Chapter 4 – Negative indicator details
This section gives the full details of the data used, the process followed and any assumptions made for each negative indicator. A higher score for negative indicators suggests a greater detraction from tranquillity.
Each indicator is presented with the following structure:
- Datasets – setting out the data sources used for both All South and Vale and Urban analysis;
- Method – describes the way in which the indicator has been modelled for both All South and Vale and Urban analysis; and
- Result – maps of the raw input data and resulting processed indicator data for both South and Vale and Urban
Indicator N01 – Seeing settlements
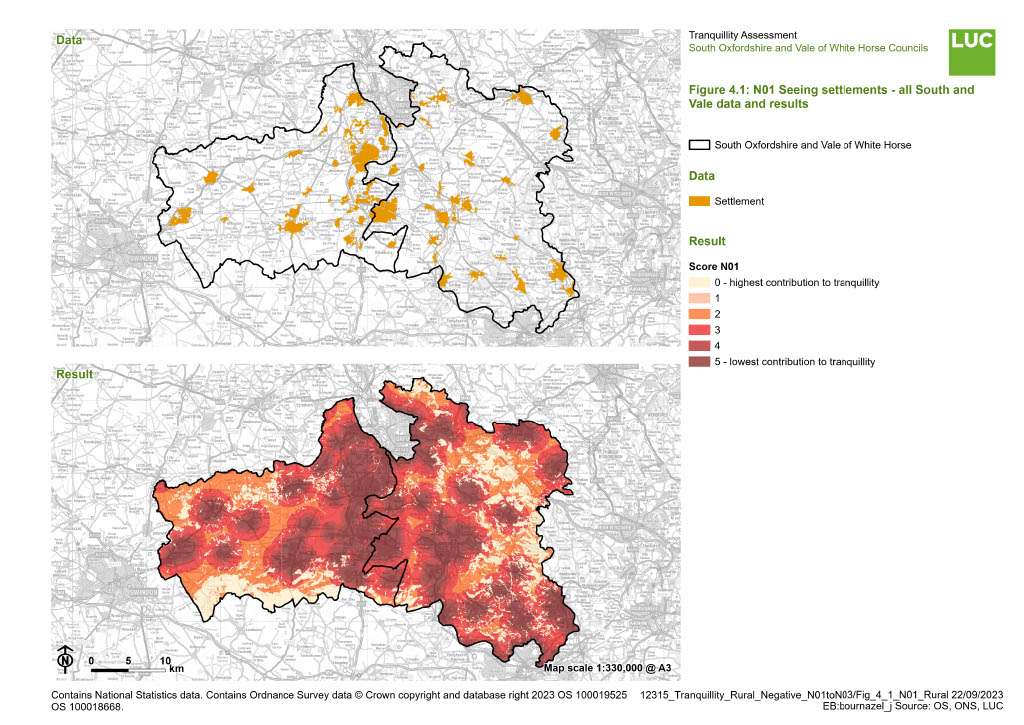
Based on stakeholder feedback, this indicator focuses only on seeing larger settlements. Stakeholders fed back that villages are often beautiful and tranquil, so they should not be included as part of this indicator.
Stakeholders also fed back that seeing settlements is not always negative; it depends on the viewing distance.
Datasets
All South and Vale: Selected Office for National Statistics (ONS) built up 2022 areas.
Urban: Selected ONS built up 2022 areas.
The settlements selected for this indicator are listed in Appendix C and include the higher tiers from the existing South Oxfordshire and Vale of White Horse settlement hierarchies, as well as settlements over 50 ha located within the 6km buffer outside of the study area.
Method
All South and Vale: Points were generated at 100m intervals and intersected with the selected settlements. Another set of points was generated at 100m intervals around the perimeter of the settlements. Using these two sets of points, visibility was calculated from each pixel of the analysis. The settlements were buffered as per the table below, and the buffers were then combined with the results of the visibility analysis. Pixels were scored based on their distance from the feature and their visibility.
Table 4-1: Scoring N01 All South and Vale
| Distance | 500m | 1km | 2km | 5km | 6km |
| Score | 5 | 4 | 3 | 2 | 1 |
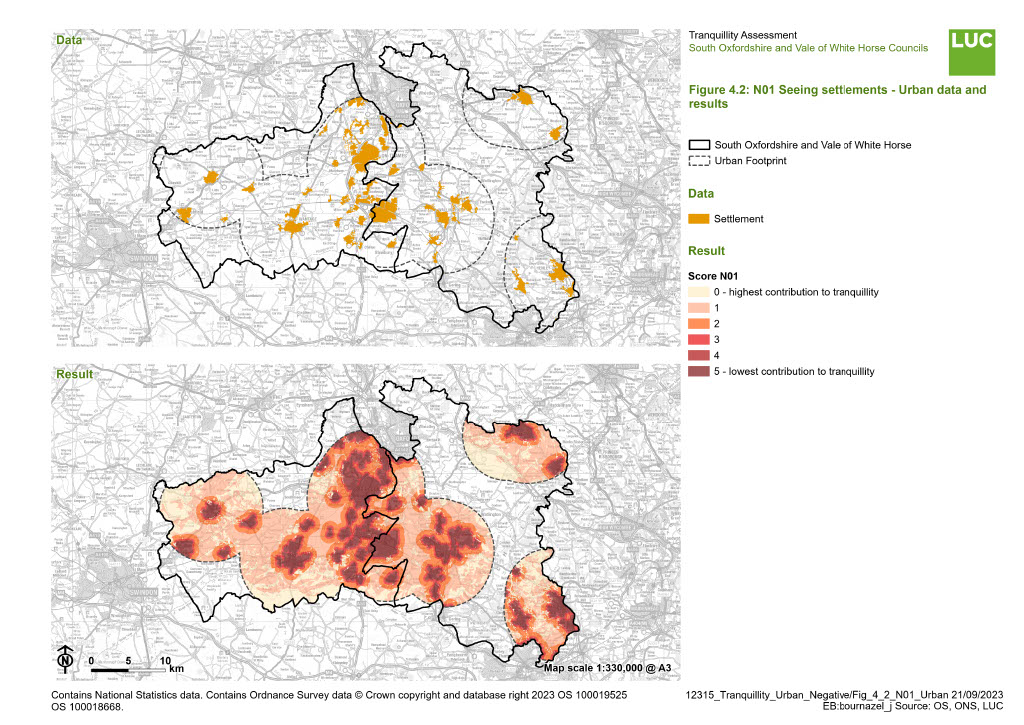
Urban: The same method as All South and Vale was applied, with 100m interval points. Buffers were generated and pixels scored as per the table below.
Table 4-2: Scoring N01 Urban
| Distance | 100m | 200m | 400m | 1km | 6km |
| Score | 5 | 4 | 3 | 2 | 1 |
Results
The results of the analysis for All South and Vale are shown in Figure 4.1 and can be explored in more details in the Results interactive web map. Urban results are shown in Figure 4.2. Visibility of more of the features measured by the indicator means that the tranquillity decreases, so higher scores represent less contribution towards tranquillity and lower scores more contribution towards tranquillity.
Figure 4.1: N01 Seeing settlements - all South and Vale data and results
×![]()
Figure 4.1: N01 Seeing settlements - all South and Vale data and results
Figure 4.2: N01 Seeing settlements - Urban data and results
×![]()
Figure 4.2: N01 Seeing settlements - Urban data and results
Indicator N02 – Seeing light pollution
Datasets
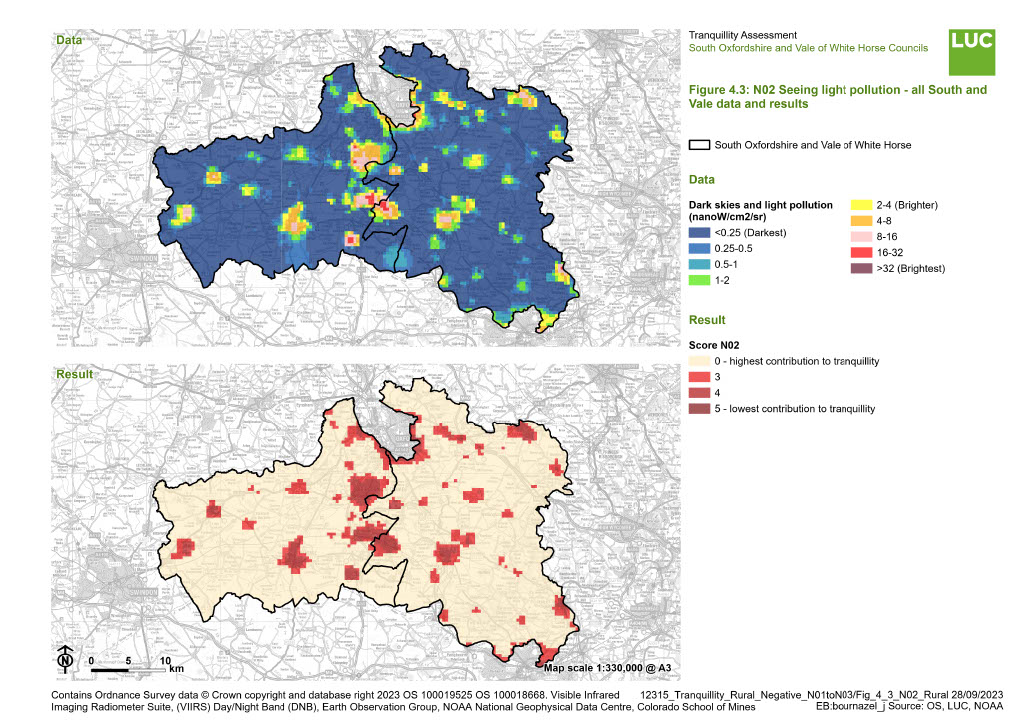
All South and Vale: LUC Dark Skies Map (output from the Dark Skies Assessment). As the original map is 400m resolution, it was resampled to 50m pixels to match the scale of analysis at All South and Vale level. It must be noted that this does not increase the precision of the data, it merely aligns the pixel sizes.
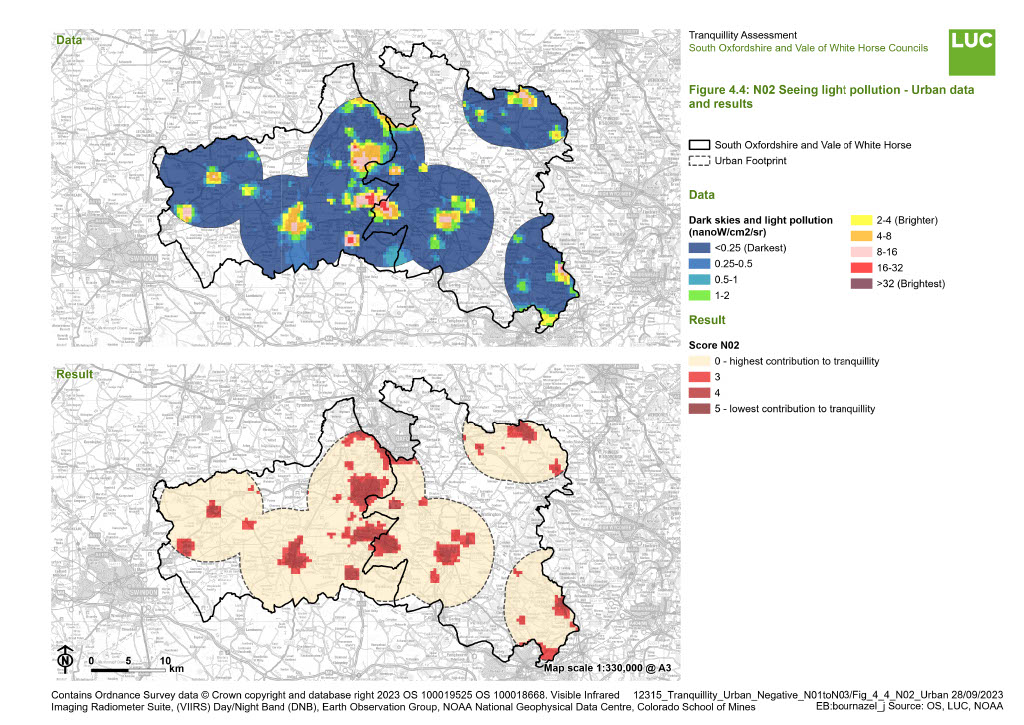
Urban: LUC Dark Skies Map (output from the Dark Skies Assessment). As the original map is 400m resolution, it was resampled to 10m pixels to match the scale of analysis at the urban areas level. It must be noted that this does not increase the precision of the data, it merely aligns the pixel sizes.
Method
All South and Vale: The dark skies map was re-classified into four categories as per the table below. The brightest pixels (>32 nanoW/cm²/sr) were scored with the highest score for detraction from tranquillity. These correspond to the Urban high district brightness environmental zone (E4) as defined in the Dark Skies Assessment and Lighting Guidance report produced as part of this landscape evidence. Pixels between 4 and 32 nanoW/ cm²/sr corresponding to the Suburban medium district brightness zone (E3) were scored with the second highest score for detraction from tranquillity. Pixels between 1 and 4 nanoW/cm²/sr, corresponding to Rural low district brightness zone (E2), were scored with a lower detraction score as they are still bright, but less so. Finally, all other pixels were scored 0 as they are darker and assumed to represent areas with the least light pollution.
Table 4-3: Scoring N02 All South and Vale
| Brightness (nanoW/cm2/sr) | >32 | 4-32 | 1-4 | <1 |
| Score | 5 | 4 | 3 | 0 |
Urban: The dark skies map was re-classified following the same method as for All South and Vale.
Table 4-4: Scoring N02 Urban
| Brightness (nanoW/cm2/sr) | >32 | 4-32 | 1-4 | <1 |
| Score | 5 | 4 | 3 | 0 |
Results
The results of the analysis for All South and Vale are shown in Figure 4.3 and can be explored in more details in the Results interactive web map. Urban results are shown in Figure 4.4. Brighter skies mean there is light pollution, therefore areas with brighter values were given a higher score for detraction from tranquillity. Higher scores represent less tranquil areas and lower scores are more tranquil.
Figure 4.3: N02 Seeing light pollution - all South and Vale data and results
×![]()
Figure 4.3: N02 Seeing light pollution - all South and Vale data and results
Figure 4.4: N02 Seeing light pollution - Urban data and results
×![]()
Figure 4.4: N02 Seeing light pollution - Urban data and results
Indicator N03 – Seeing large non natural infrastructure
Datasets
All South and Vale: OS MasterMap (industrial buildings and warehouses selected using OS AddressBasePlus as detailed in Appendix D), Department for Business, Energy and Industrial Strategy (BEIS) Renewables Energy Planning Database (database filtered on ‘Development’ = ‘Under construction’ or ‘operational’ ), National grid towers (400kV pylons)
Urban: same as All South and Vale analysis.
Method
Features that are likely to be large, non-natural infrastructure were extracted from the datasets listed above. Specific buildings in Harwell Campus as well as Culham were added following stakeholder feedback on the pilot mapping as these specific buildings were not included in the initial extract from OS AddressBasePlus, however due to their height they were felt to contribute towards this indicator. A mix of assumed heights as well as heights based on stakeholder feedback were assigned to each type of feature as described in the following table. Note that the 8m building height that was built in the DSM was subtracted from the initial assumed/suggested building heights in the table below to avoid double counting building height in the visibility analysis.
Table 4-5: Heights assigned to features for N03
| Feature | Data source | Assumed height (metres) |
| Industrial buildings / warehouses (OS selected categories) | OSMM / OS AddressBasePlus | 7 |
| Harwell Campus and the old Didcot power site | OSMM / OS AddressBasePlus/Stakeholder feedback | 12 |
| Joint European Torus buildings in Culham | OSMM / OS AddressBasePlus/Stakeholder feedback | 24 |
| Anaerobic / sewage digestion | BEIS REPD | 40 |
| Battery / biomass / hydro | BEIS REPD | 3 |
| Landfill gas | BEIS REPD | 20 |
| Solar photovoltaics | BEIS REPD | 2.7 |
| 400kV pylons | National Grid | 50 |
| Wind onshore turbine capacity 1-2 MW | BEIS REPD | 81 |
All South and Vale: The selected OS Mastermap industrial/warehouse buildings were buffered by 300m to ensure that they were all selected in the next step, even though some of them have a small footprint. Points were generated at 100m intervals and intersected with the buffered industrial/warehouses buildings. Using the intersected industrial/warehouse points and the REPD and National Grid tower points, visibility was calculated from each pixel of the analysis, using the height that was assigned for each feature type as per the table above. The industrial/warehouse buildings, REPD and National Grid tower points were buffered as per the table below, and the buffers were then combined with the results of the visibility analysis. Pixels were scored based on their distance from the feature and their visibility.
Table 4-6: Scoring N03 All South and Vale
| Distance | 500m | 1km | 2km | 5km | 6km |
| Score | 5 | 4 | 3 | 2 | 1 |
Urban: The same method as All South and Vale was applied, with 100m intervals points. Buffers were generated and pixels scored as per the table below.
Table 4-7: Scoring N03 Urban
| Distance | 100m | 200m | 400m | 1km | 6km |
| Score | 5 | 4 | 3 | 2 | 1 |
Results
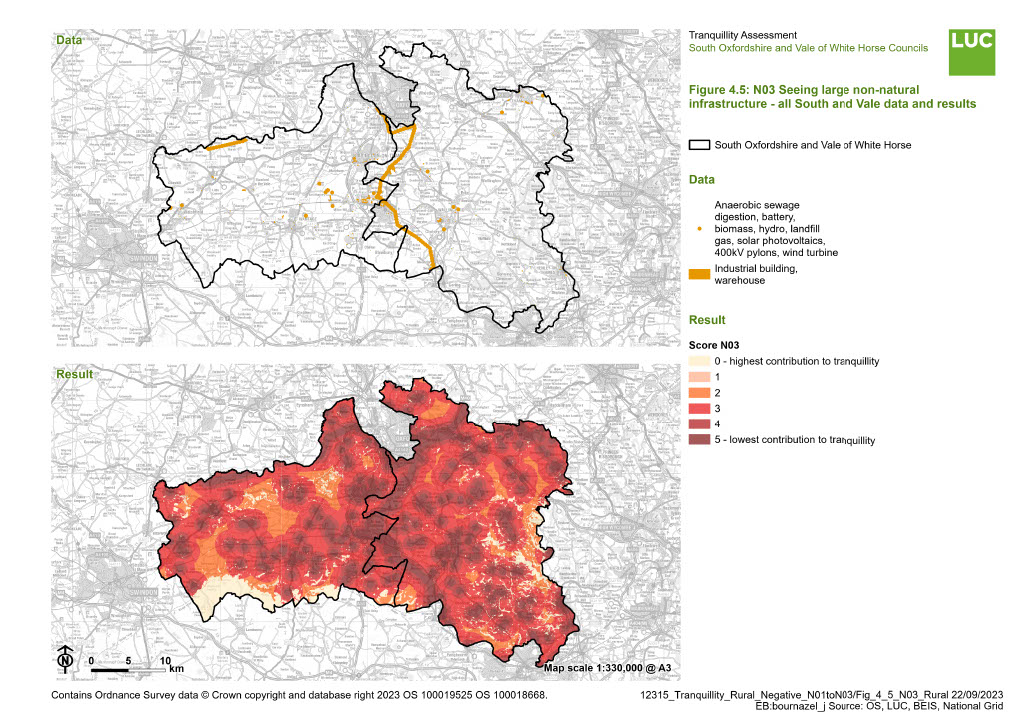
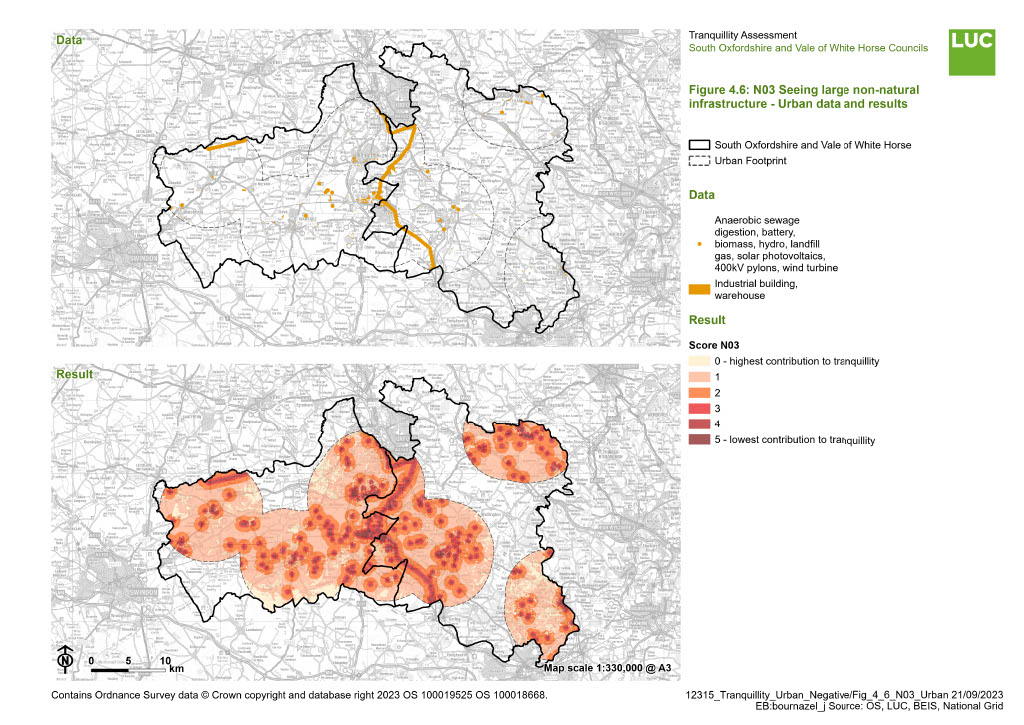
The results of the analysis for All South and Vale are shown in Figure 4.5 and can be explored in more details in the Results interactive web map. Urban results are shown in Figure 4.6. Visibility of more of the features measured by the indicator means that the tranquillity decreases, so higher scores represent less contribution towards tranquillity and lower scores more contribution towards tranquillity.
Figure 4.5: N03 Seeing large non natural infrastructure - all South and Vale data and results
×![]()
Figure 4.5: N03 Seeing large non natural infrastructure - all South and Vale data and results
Figure 4.6: N03 Seeing large non natural infrastructure - Urban data and results
×![]()
Figure 4.6: N03 Seeing large non natural infrastructure - Urban data and results
Indicator N04 – Seeing major roads
Datasets
All South and Vale: OS Open Roads (selected categories: single carriageway A-roads and motorway and dual carriageway A-roads).
Urban: same as All South and Vale analysis.
Method
All South and Vale: The analysis was performed separately for single carriageway A-roads and dual carriageway/motorways. Points were generated every 100m along the two types of roads. Visibility was calculated from each pixel of the analysis using each set of points. Each road type was buffered as per the table below, and the buffers were then combined with the results of the visibility analysis. Pixels were scored based on their distance from the feature and their visibility. The scored pixels for each road type were combined together to obtain the final ‘seeing major roads’ results. When pixels overlapped while combining both road types results, the highest score per pixel was kept.
Table 4-8: Scoring N04 All South and Vale
| Distance | 500m | 1km | 2km | 5km | 6km |
| Motorway and dual carriageway A -roads Score | 5 | 4 | 3 | 3 | 2 |
| Single carriageway A-roads – Score | 4 | 3 | 2 | 2 | 1 |
Urban: The same method as All South and Vale was applied, with 100m points along each road type. Buffers were generated and pixels scored as per the table below.
Table 4-9: Scoring N04 Urban
| Distance | 100m | 200m | 400m | 1km | 6km |
| Motorway and dual carriageway A -roads Score | 5 | 4 | 3 | 3 | 2 |
| Single carriageway A-roads – Score | 4 | 3 | 2 | 2 | 1 |
Results
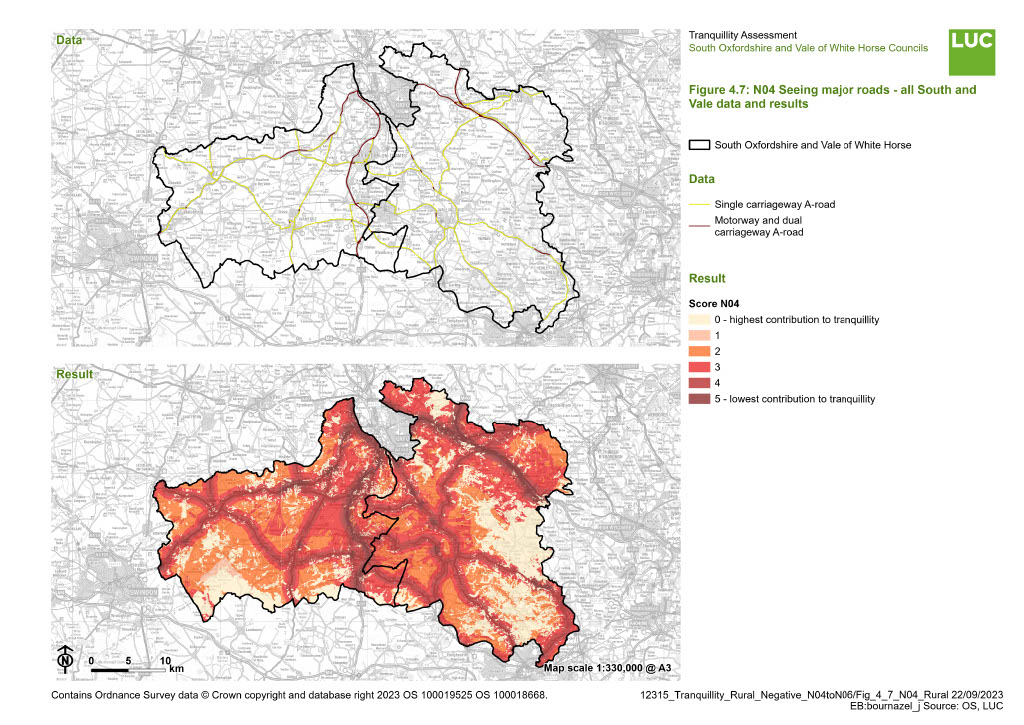
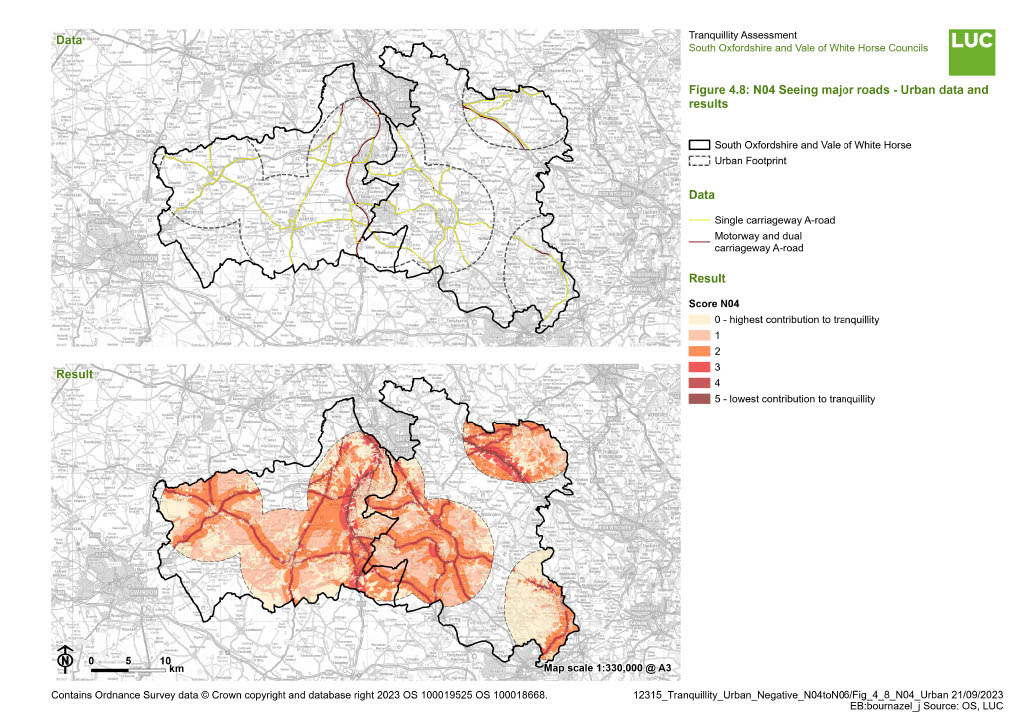
The results of the analysis for All South and Vale are shown in Figure 4.7 and can be explored in more details in the Results interactive web map. Urban results are shown in Figure 4.8. Visibility of more of the features measured by the indicator means that the tranquillity decreases, so higher scores represent less contribution towards tranquillity and lower scores more contribution towards tranquillity.
Figure 4.7: N04 Seeing major roads - all South and Vale data and results
×![]()
Figure 4.7: N04 Seeing major roads - all South and Vale data and results
Figure 4.8: N04 Seeing major roads - Urban data and results
×![]()
Figure 4.8: N04 Seeing major roads - Urban data and results
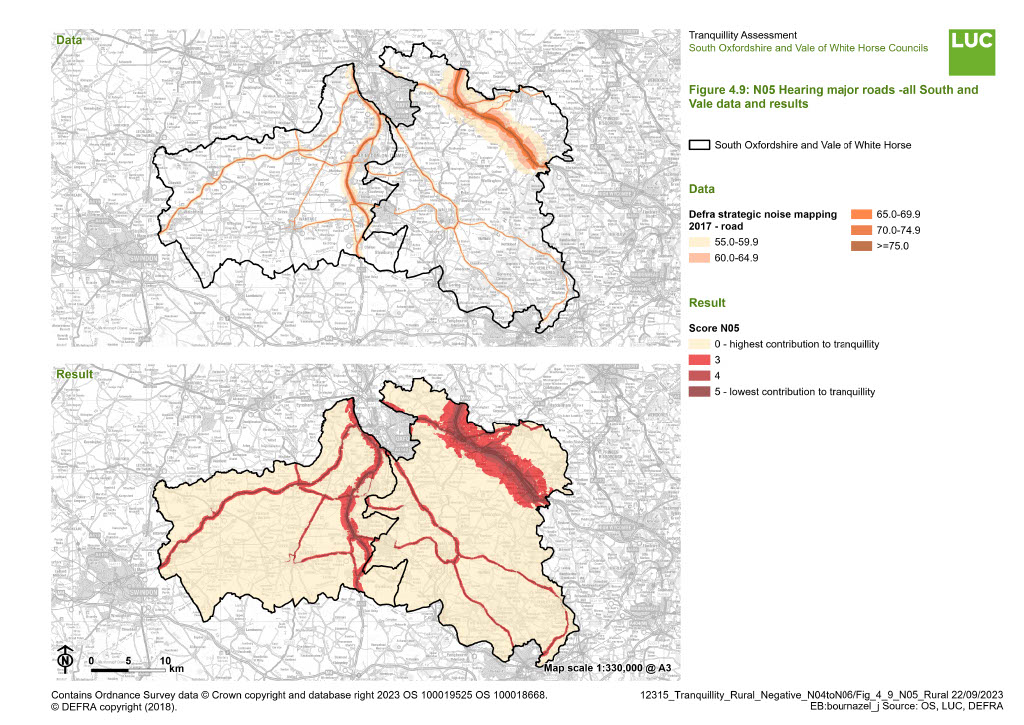
Indicator N05 – Hearing major roads
Datasets
All South and Vale: Defra Strategic Noise Mapping 2017 round 3 (road, day-evening-night noise level, or Lden, that accounts for both day and night average noise).
Urban: same as All South and Vale analysis.
Method
All South and Vale: The Defra road noise mapping dataset was re-classified into three categories as per the table below. Highest scores were assigned to the loudest pixels, representing least tranquil areas.
| Decibel | >=65 | 60 – 64.9 | 55- 59.9 | <55 |
| Score | 5 | 4 | 3 | 0 |
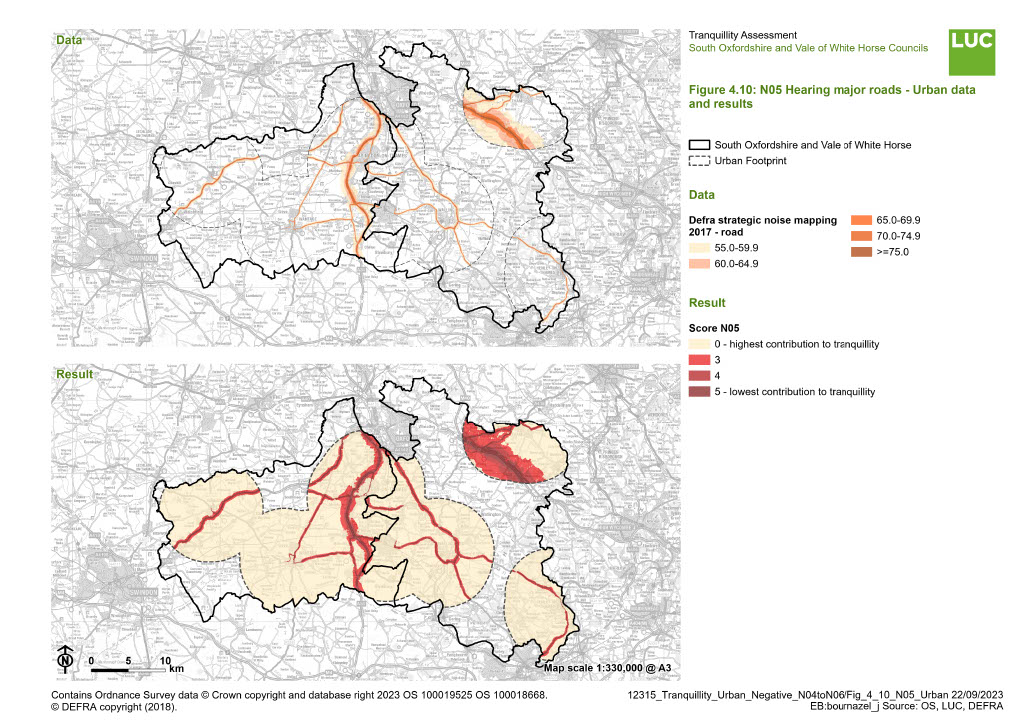
Urban: same as All South and Vale analysis.
Although the EEA technical report (2014) [See reference [i]] indicates that Lden 50 dB should be the upper limit for relatively quiet areas in urban locations, it was not possible to use this minimum threshold due to the Defra road noise Lden dataset being pre-categorised into noise classes with the lowest one being 55.0-59.9 dB.
Table 4-11: Scoring N05 Urban
| Decibel | >=65 | 60 – 64.9 | 55- 59.9 | <55 |
| Score | 5 | 4 | 3 | 0 |
Results
The results of the analysis for All South and Vale are shown in Figure 4.9 and can be explored in more details in the Results interactive web map. Urban results are shown in Figure 4.10. The higher the decibel value, the more it detracts from tranquillity, so higher scores represent less contribution towards tranquillity and lower scores more contribution towards tranquillity.
[i] European Environment Agency. (2014) Good practice guide on quiet areas, Technical report N0 4/2014, doi: 10.2800/12611. Available at: https://www.eea.europa.eu/publications/good-practice-guide-on-quiet-areas
Figure 4.9: N05 Hearing major roads - all South and Vale data and results
×![]()
Figure 4.9: N05 Hearing major roads - all South and Vale data and results
Figure 4.10: N05 Hearing major roads - Urban data and results
×![]()
Figure 4.10: N05 Hearing major roads - Urban data and results
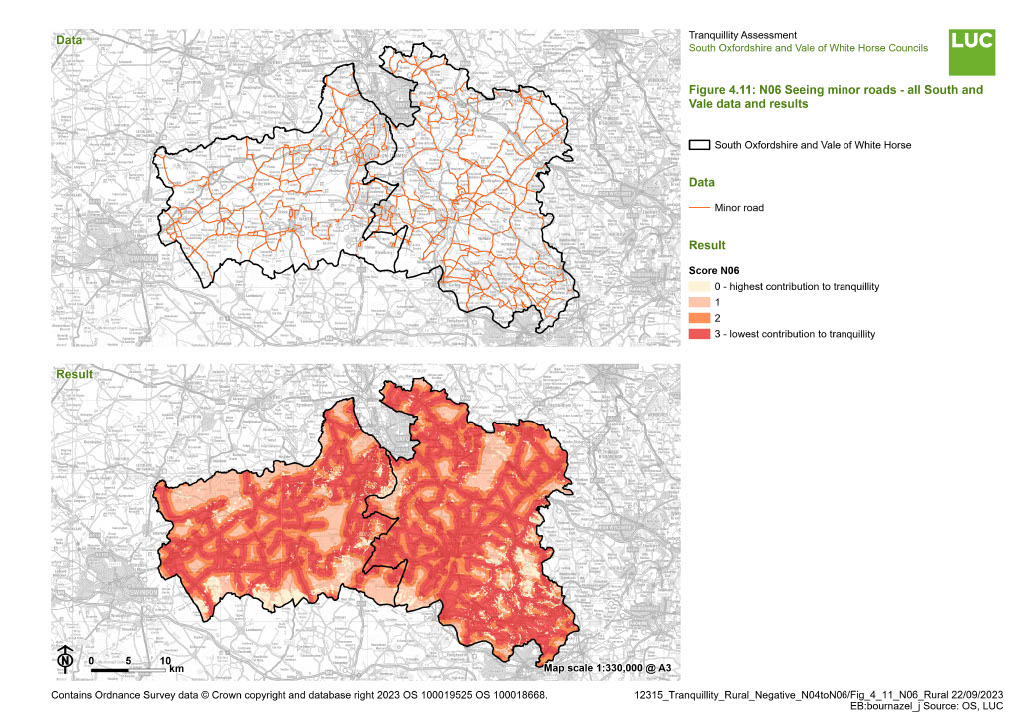
Indicator N06 – Seeing minor roads
Stakeholder feedback on this indicator following the pilot mapping highlighted that it would potentially account for quiet rural lanes which may not negatively affect tranquillity. Consideration was given to omitting the indicator. After further discussions, this indicator was kept in the analysis and no edits were made to the way it is mapped for the final assessment because the assumption is that regardless of how minor a road is, it would always be preferable not to see a road in terms of tranquillity.
Datasets
All South and Vale: OS Open Roads (selected categories: B-roads and classified un-numbered).
Urban: same as All South and Vale analysis.
Method
All South and Vale: Points were generated every 100m along the selected roads and visibility was calculated from each pixel of the analysis. The minor roads were buffered as per the table below, and the buffers were then combined with the results of the visibility analysis. Pixels were scored based on their distance from the feature and their visibility.
Table 4-12: Scoring N06 All South and Vale
| Distance | 500m | 1km | 2km | 5km | 6km |
| Score | 3 | 2 | 1 | 1 | 0 |
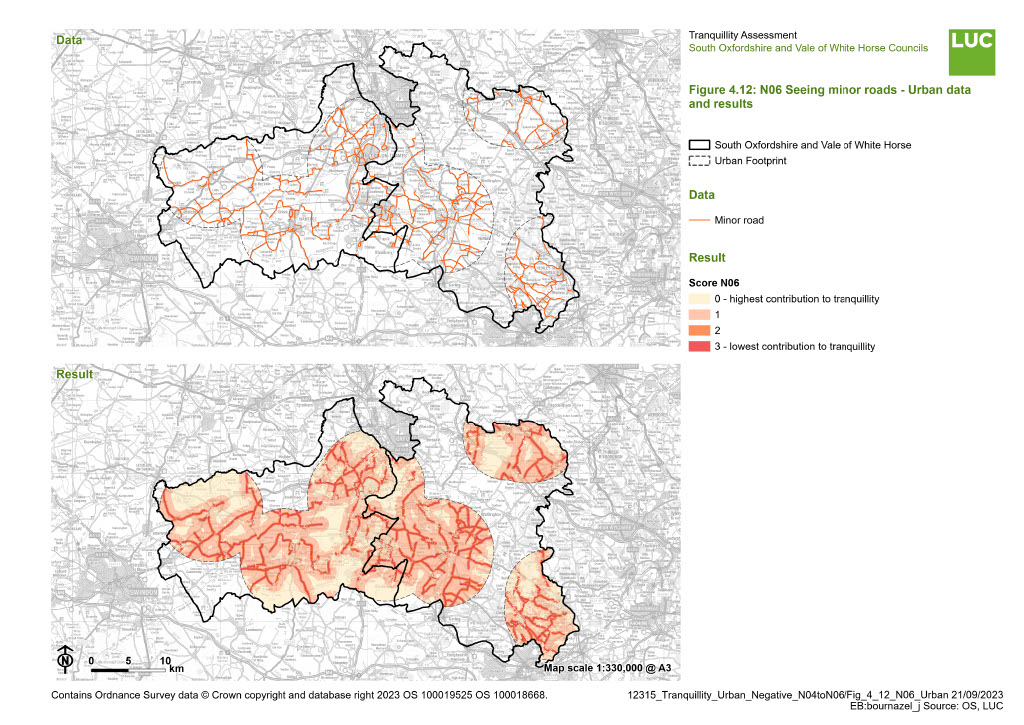
Urban: The same method as All South and Vale was applied, with 100m points along minor roads. Buffers were generated and pixels scored as per the table below.
Table 4-13: Scoring N06 Urban
| Distance | 100m | 200m | 400m | 1km | 6km |
| Score | 3 | 2 | 1 | 1 | 0 |
Results
The results of the analysis for All South and Vale are shown in Figure 4.11 and can be explored in more details in the Results interactive web map. Urban results are shown in Figure 4.12. Visibility of more of the features measured by the indicator means that the tranquillity decreases, so higher scores represent less contribution towards tranquillity and lower scores more contribution towards tranquillity.
Figure 4.11: N06 Seeing minor roads - all South and Vale data and results
×![]()
Figure 4.11: N06 Seeing minor roads - all South and Vale data and results
Figure 4.12: N06 Seeing minor roads - Urban data and results
×![]()
Figure 4.12: N06 Seeing minor roads - Urban data and results
Indicator N07 – Hearing minor roads
Datasets
Minor roads are not mapped as part of the Defra noise mapping therefore a more simplistic approach was required to map this indicator.
All South and Vale: OS Open Roads (selected categories: B-roads and classified un-numbered).
Urban: same as All South and Vale analysis.
Method
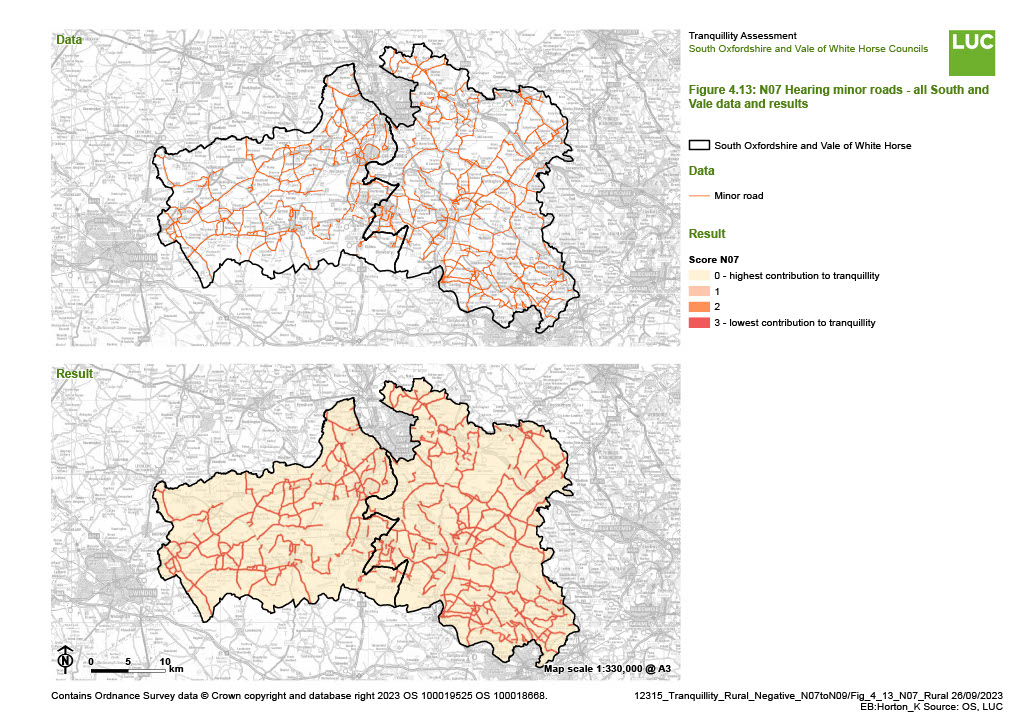
All South and Vale: The minor roads were buffered as per the table below, and pixels were scored based on their distance from the feature. The highest scores were assigned to pixels that are very close to minor roads, representing a greater detraction from tranquillity due to the sound being louder.
Table 4-14: Scoring N07 All South and Vale
| Distance | 50m | 100m | 150m | 6km |
| Score | 3 | 2 | 1 | 0 |
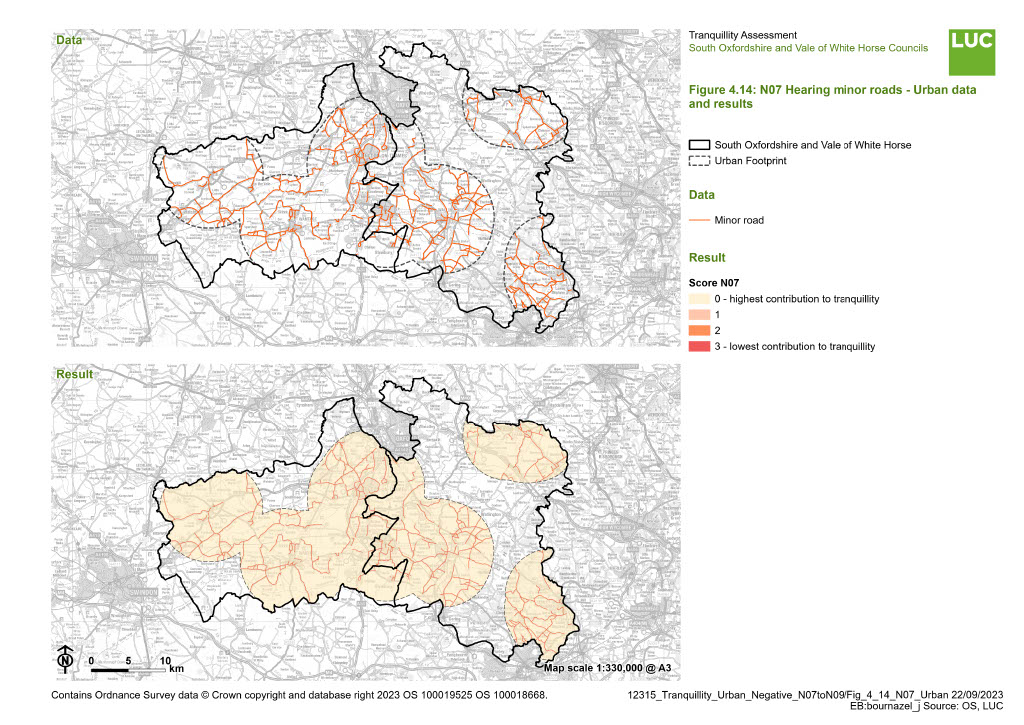
Urban: The same method as All South and Vale was applied. Buffers were generated and pixels scored as per the table below.
Table 4-15: Scoring N07 Urban
| Distance | 10m | 30m | 50m | 6km |
| Score | 3 | 2 | 1 | 0 |
Results
The results of the analysis for All South and Vale are shown in Figure 4.13 and can be explored in more details in the Results interactive web map. Urban results are shown in Figure 4.14. The closer to the source, the more it detracts from tranquillity, so higher scores represent less contribution towards tranquillity and lower scores more contribution towards tranquillity.
Figure 4.13: N07 Hearing minor roads - all South and Vale data and results
×![]()
Figure 4.13: N07 Hearing minor roads - all South and Vale data and results
Figure 4.14: N07 Hearing minor roads - Urban data and results
×![]()
Figure 4.14: N07 Hearing minor roads - Urban data and results
Indicator N08 – Seeing railways
Datasets
All South and Vale: Railways extracted from OS Mastermap
Urban: same as All South and Vale analysis.
Method
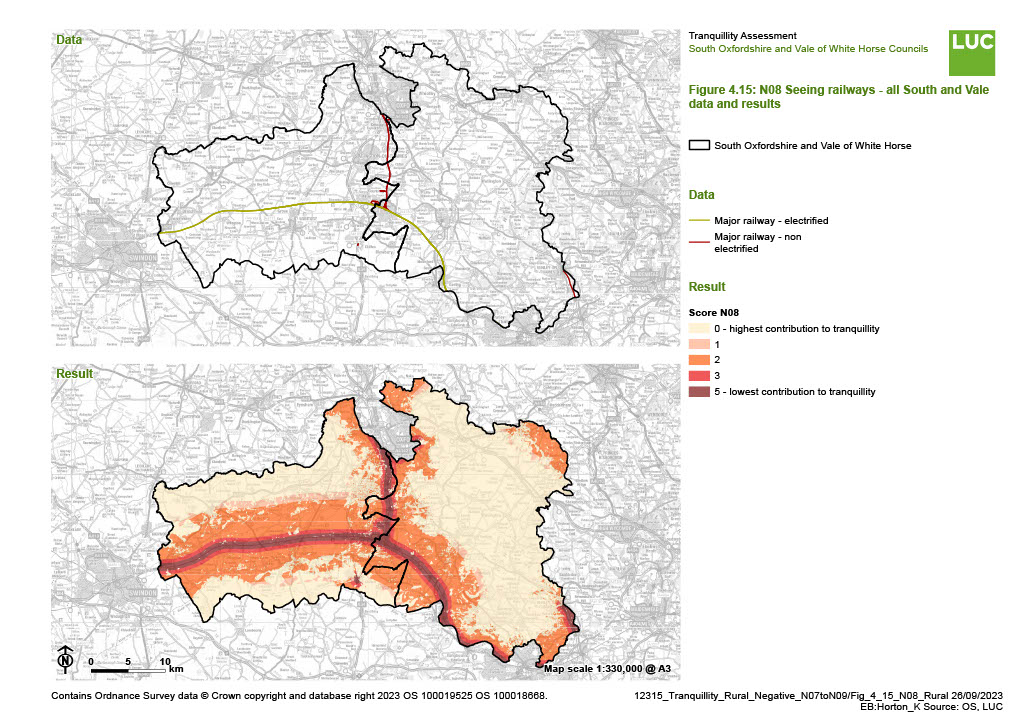
All South and Vale: The analysis was performed separately for the electrified tracks which cross the study area from East to West and the track with no electrification (North-South). Points were generated every 100m along the two different railway tracks and visibility was calculated from each pixel of the analysis using each set of points. Based on stakeholder feedback, the height for electrified tracks was set to 8.25m and the default height of 3m was used for non-electrified tracks as per the CPRE methodology. Each track was buffered as per the table below, and the buffers were then combined with the results of the visibility analysis. Pixels were scored based on their distance from the feature and their visibility. The scored pixels for each track type were combined together to obtain the final ‘Seeing railways’ results. When pixels overlapped while combining both electrified and non-electrified tracks results, the highest score per pixel was kept.
Table 4-16: Scoring N08 All South and Vale
| Distance | 500m | 1km | 2km | 5km | 6km |
| Score | 5 | 3 | 2 | 2 | 1 |
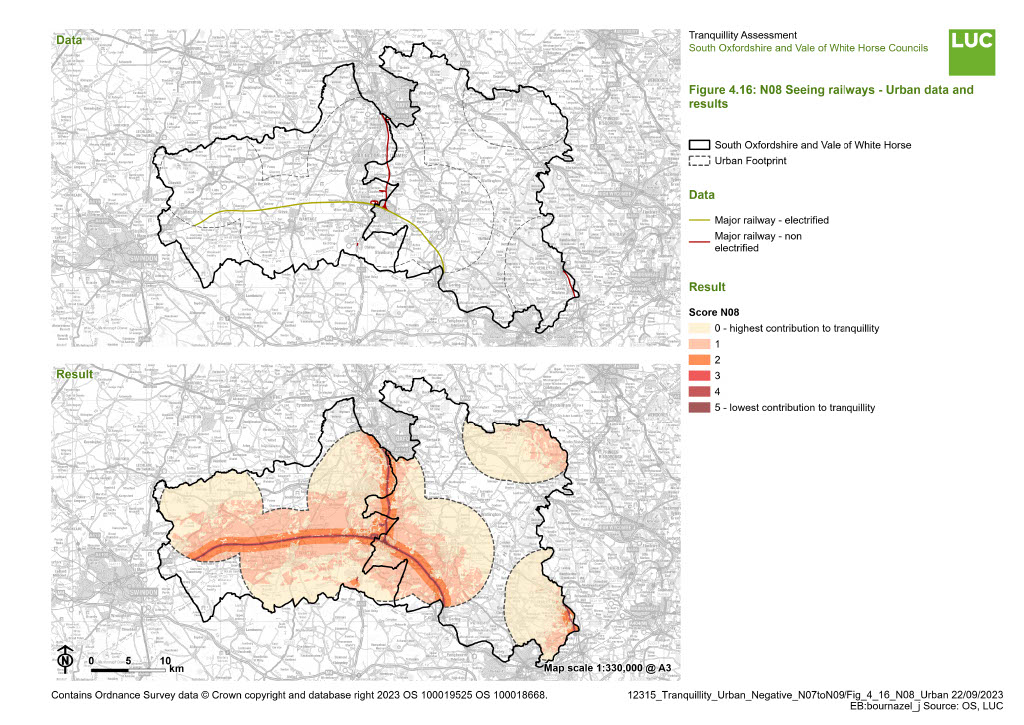
- Urban: The same method as All South and Vale was applied, with 100m points along railway tracks. Buffers were generated and pixels scored as per the table below.
Table 4-17: Scoring N08 Urban
| Distance | 100m | 200m | 400m | 1km | 6km |
| Score | 5 | 3 | 2 | 2 | 1 |
Results
The results of the analysis for All South and Vale are shown in Figure 4.15 and can be explored in more details in the Results interactive web map. Urban results are shown in Figure 4.16. Visibility of more of the features measured by the indicator means that the tranquillity decreases, so higher scores represent less contribution towards tranquillity and lower scores more contribution towards tranquillity.
Figure 4.15: N08 Seeing railways - all South and Vale data and results
×![]()
Figure 4.15: N08 Seeing railways - all South and Vale data and results
Figure 4.16: N08 Seeing railways - Urban data and results
×![]()
Figure 4.16: N08 Seeing railways - Urban data and results
Indicator N09 – Hearing major railways
Datasets
All South and Vale: Defra Strategic Noise Mapping 2017 round 3 (railway, Lden that accounts for both day and night average noise).
Urban: same as All South and Vale analysis.
Method
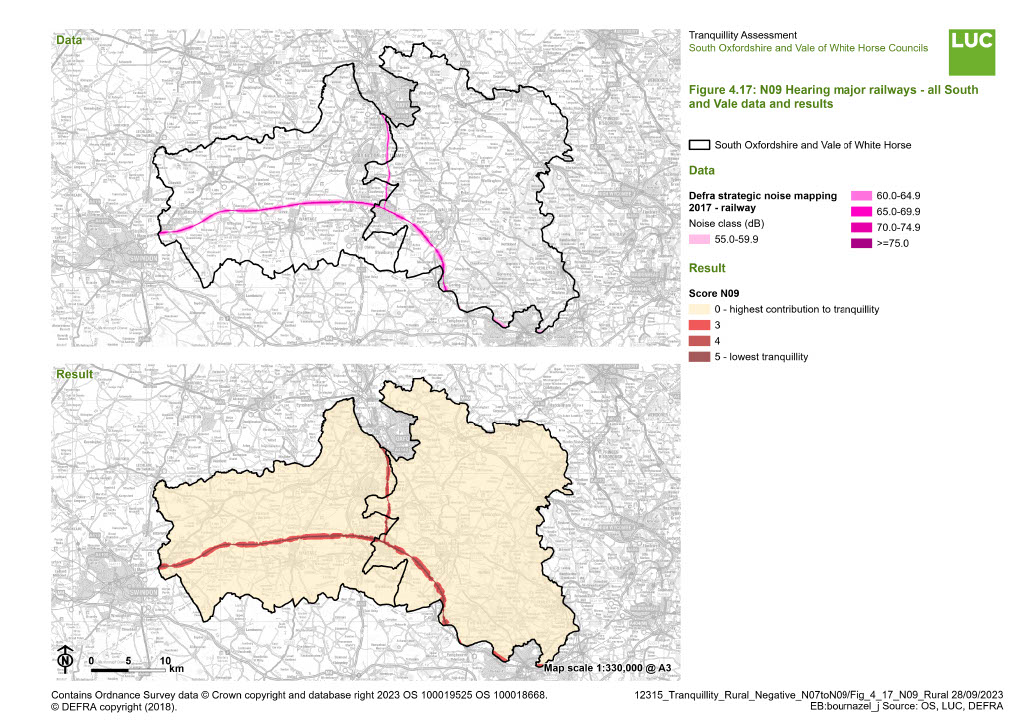
All South and Vale: The Defra railway noise mapping dataset was re-classified into four categories as per the table below. Highest scores were assigned to the loudest pixels, representing least tranquil areas.
Table 4-18: Scoring N09 All South and Vale
| Decibel | >=65 | 60 – 64.9 | 55- 59.9 | <55 |
| Score | 5 | 4 | 3 | 0 |
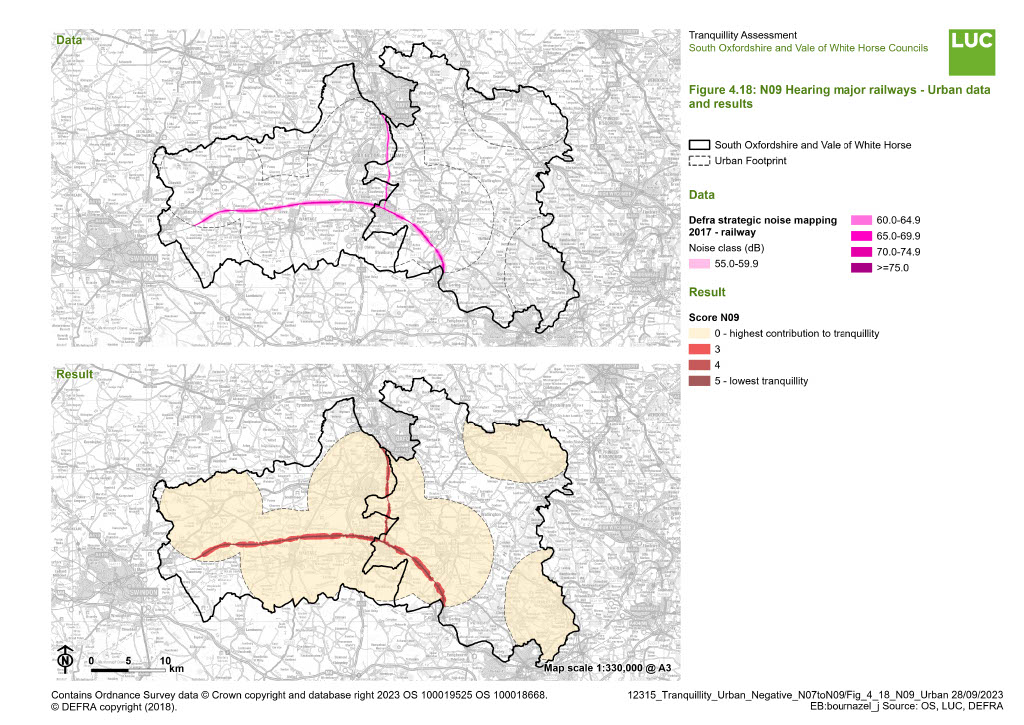
Urban: same as All South and Vale analysis.
Although the EEA technical report (2014) [See reference [i]] indicates that Lden 50 dB should be the upper limit for relatively quiet areas in urban locations, it was not possible to use this minimum threshold due to the Defra road noise Lden dataset being pre-categorised into noise classes with the lowest one being 55.0-59.9 dB.
Table 4-19: Scoring N09 Urban
| Decibel | >=65 | 60 – 64.9 | 55- 59.9 | <55 |
| Score | 5 | 4 | 3 | 0 |
Results
The results of the analysis for All South and Vale are shown in Figure 4.17 and can be explored in more details in the Results interactive web map. Urban results are shown in Figure 4.18. The higher the decibels, the more it detracts from tranquillity, so higher scores represent less contribution towards tranquillity and lower scores more contribution towards tranquillity.
[i] European Environment Agency. (2014) Good practice guide on quiet areas, Technical report N0 4/2014, doi: 10.2800/12611. Available at: https://www.eea.europa.eu/publications/good-practice-guide-on-quiet-areas
Figure 4.17: N09 Hearing major railways - all South and Vale data and results
×![]()
Figure 4.17: N09 Hearing major railways - all South and Vale data and results
Figure 4.18: N09 Hearing major railways - Urban data and results
×![]()
Figure 4.18: N09 Hearing major railways - Urban data and results
Indicator N10 – Seeing and/or hearing low flying airplanes
This indicator includes both seeing and hearing low flying airplanes as it was considered that airplanes would be seen during arrival/departure when they can also be heard the most.
Stakeholder feedback indicated that whilst there are no large commercial airports in either district, there are some airfields, specifically RAF Benson which is active. Stakeholders suggested the inclusion of the flight paths of RAF Brize Norton which passes over Vale of White Horse as well as Heathrow flight paths which pass over parts of the Chilterns National Landscape. Stakeholders suggested including data on helicopters because these cause the most disturbance in the area, however this data was not available at the time of the analysis.
Chalgrove Airfield is used by a company to test ejector seats and Abingdon Airfield is used for occasional training by the RAF, and due to their infrequent use, were removed from the analysis following stakeholder feedback.
Datasets
All South and Vale: RAF Benson airfield was extracted from the Landscape Character Area (LCA) 2017 datasets, and was then digitised using OS Mastermap and aerial imagery to move the boundaries to only include the airfield.
No data in GIS format could be found showing Heathrow and RAF Brize Norton flightpaths. A workaround was to digitise the arrival flight paths using the flight paths overview for Heathrow airport. Only arrival flight paths over the south east of South Oxfordshire were digitised as it appeared that the departure paths did not intersect with the study area. Main flightpath data for RAF Brize Norton was digitised from maps hosted by the RAF.
Urban: same as All South and Vale analysis.
Method
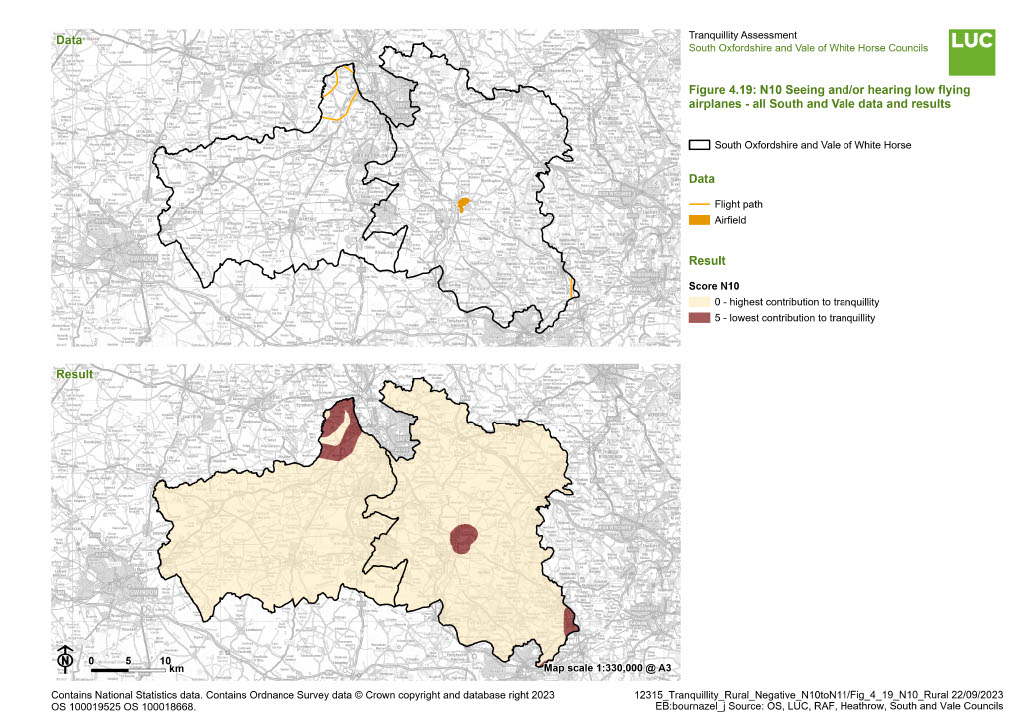
All South and Vale: An in depth literature review was carried out as part of the Wales Tranquillity project in order to process hearing low flying aircraft data. This research findings were directly applied to assess ‘seeing and/or hearing low flying aircraft’ in South Oxfordshire and Vale of White Horse Districts. This previous project found that the average distance of the outermost buffer from the runaway was calculated as 1km. Therefore a 1km buffer was used as the extent of sound impacts of RAF Benson airfield, and Heathrow and RAF Brize Norton flight paths, and highest scores were assigned to the pixels within this 1km buffer, representing the greatest detraction from tranquillity as per the table below.
Table 4-20: Scoring N10
| Distance | 1km | >1km |
| Score | 5 | 0 |
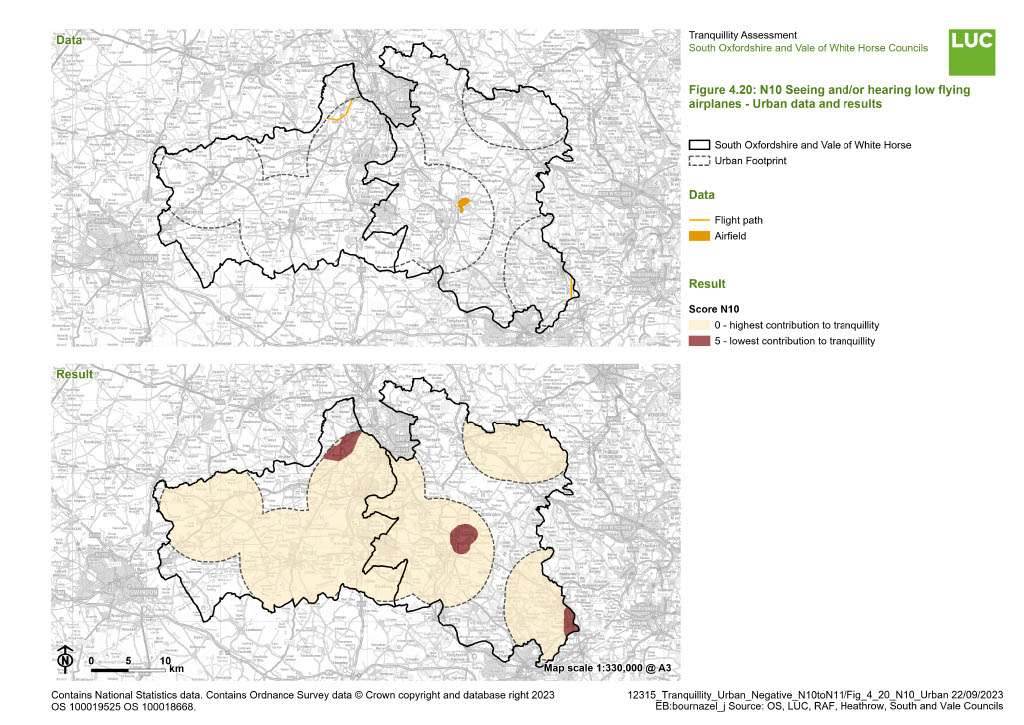
Urban: For this indicator, the scores were applied in the same way for both rural and urban analysis, as per the table above.
Results
The results of the analysis for All South and Vale are shown in Figure 4.19 and can be explored in more details in the Results interactive web map. Urban results are shown in Figure 4.20. The closer the source, the louder the sound is anticipated to be and the more it is expected to detract from tranquillity. Therefore higher scores represent less contribution towards tranquillity and lower scores more contribution towards tranquillity.
Figure 4.19: N10 Seeing and/or hearing low flying airplanes - all South and Vale data and results
×![]()
Figure 4.19: N10 Seeing and/or hearing low flying airplanes - all South and Vale data and results
Figure 4.20: N10 Seeing and/or hearing low flying airplanes - Urban data and results
×![]()
Figure 4.20: N10 Seeing and/or hearing low flying airplanes - Urban data and results
Indicator N11 – Hearing non-natural sounds
This indicator has used data where it was available, solely focussing on static non-natural sounds.
Initially MOD land data was considered for this indicator, however following stakeholder feedback it appeared that MOD data would be better suited to indicator N10, so this data was not included in this indicator to avoid double counting.
Quarries were also explored as part of this indicator, but following stakeholder feedback, quarries were not considered to be a detractor from tranquillity (see Appendix A for full stakeholder feedback).
Datasets
All South and Vale: BEIS Renewables Energy Planning Database (selected category: wind onshore); extracted ‘Strategic employment sites’ and ‘Employment allocations’ from the South Oxfordshire Local Plan 2031 and Vale of White Horse Local Plan 2035
Urban: same as All South and Vale analysis.
Method
All South and Vale: Sound measurements for the above datasets were quite different and so the analysis was separated into two parts, then combined as a final step.
For wind turbines, the scores were applied to each pixel as per the table below, based on a sound measurement of 45dB at 300m. This sound measurement was provided by LUC’s renewable energy experts as part of the Tranquillity and Place Sound Environment project [See reference [i]] as the maximum acceptable level that wind turbines will produce at this distance. All pixels more than 1,700 metres from a turbine were given a score of 0 (no detracting sound from turbines).
[i] Green C, Manson D, Chamberlain K, Grace I. (2023). NRW Report No: 660 , 100 pp, NRW. Available at: https://storymaps.arcgis.com/stories/865c1876d9f64280a3dfc6e2769a46a5
Table 4-21: Scoring wind turbines for N11 – All South and Vale
| Distance | 300m | 600m | 1200m | 1700m | 6km |
| Decibel | >45 | 45-39 | 39-33 | 33-30 | <30 |
| Score | 5 | 4 | 3 | 2 | 0 |
For the sounds coming from industry sites, the scores were based on sound measurements of 89 dB at source. Scores were applied as below.
Table 4-22: Scoring sounds from industry for N11 – All South and Vale
| Distance | 30m | 60m | 120m | 250m | 320m |
| Decibel | 80-50 | 50-44 | 44-38 | 38-32 | 32-30 |
| Score | 5 | 4 | 3 | 2 | 1 |
Turbines and other sounds scores were combined with the highest score taking precedence when overlaps were present for each pixel of the analysis.
Urban: The same method as All South and Vale was applied but using the scores and distances as below.
Table 4-23: Scoring wind turbines for N11 – Urban
| Distance | 300m | 530m | 6km |
| Decibel | >45 | 45-40 | <40 |
| Score | 4 | 3 | 0 |
Table 4-24: Scoring sounds from industry for N11 – Urban
| Distance | 15m | 30m | 60m |
| Decibel | 80-56 | 56-50 | 50-44 |
| Score | 5 | 4 | 3 |
Results
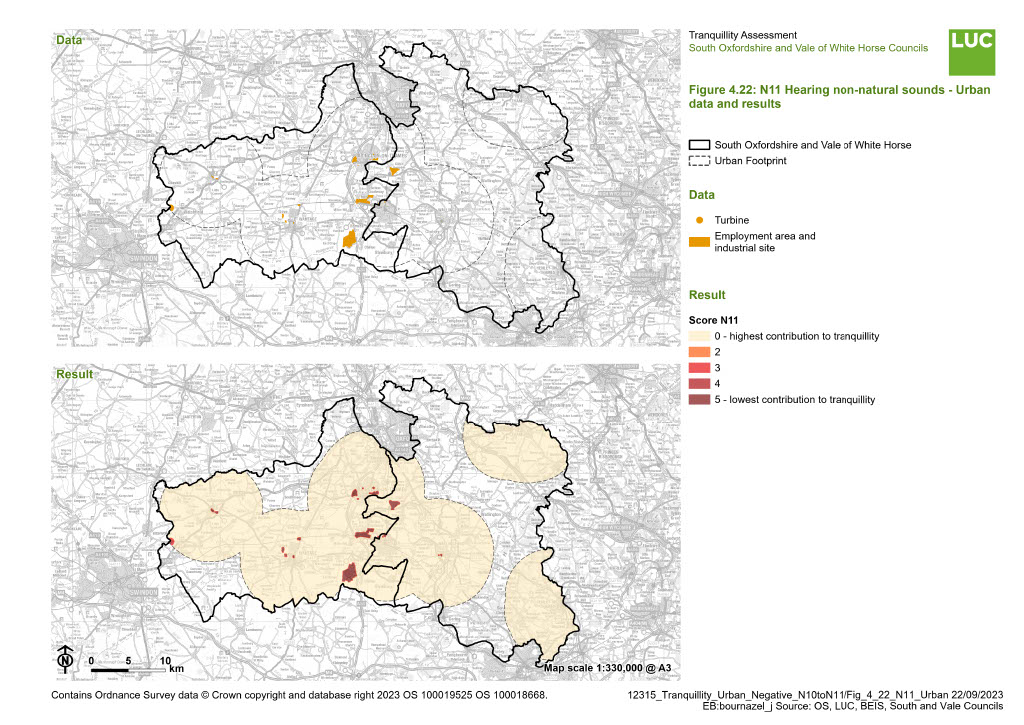
The results of the analysis for All South and Vale are shown in Figure 4.21 and can be explored in more details in the Results interactive web map. Urban results are shown in Figure 4.22. The louder the sound the more it is expected to detract from tranquillity, so higher scores represent less contribution towards tranquillity and lower scores more contribution towards tranquillity.
Figure 4.21: N11 Hearing non-natural sounds - all South and Vale data and results

×![]()
Figure 4.21: N11 Hearing non-natural sounds - all South and Vale data and results
Figure 4.22: N11 Hearing non-natural sounds - Urban data and results
×![]()
Figure 4.22: N11 Hearing non-natural sounds - Urban data and results