Chapter 1 – Introduction
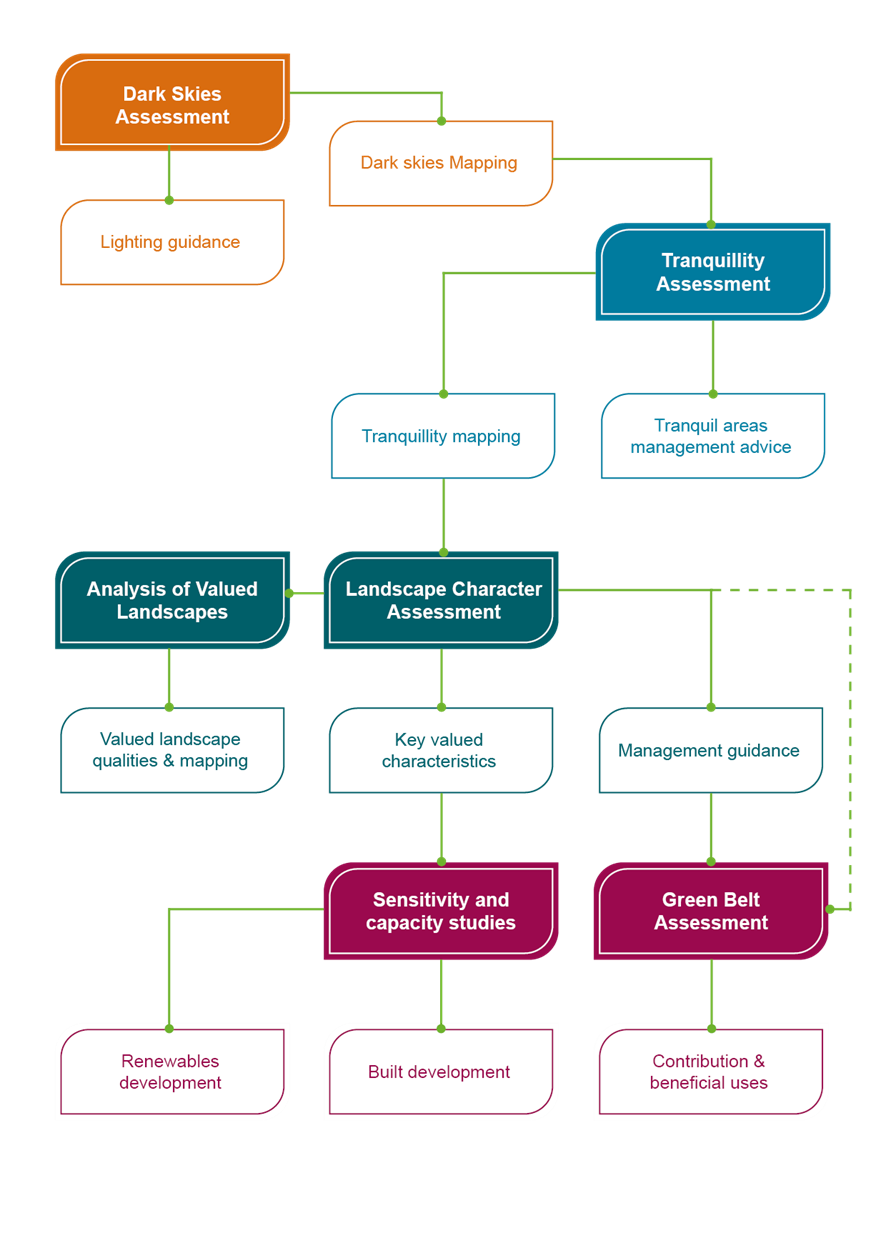
In January 2023, South Oxfordshire and Vale of White Horse District Councils commissioned LUC to produce landscape evidence contributing to the Joint Local Plan that will guide development in the districts to 2041. An overview of the suite of landscape evidence commissioned is shown in Figure 1.1.
Figure 1.1: Suite of landscape evidence bases
×![]()
Figure 1.1: Suite of landscape evidence bases
The second requirement of this landscape evidence is to assess, describe and map relative levels of tranquillity across South Oxfordshire and Vale of White Horse District Councils in a clear, consistent and comprehensive way. Tranquillity is a key factor contributing to landscape character and landscape value. This tranquillity assessment will inform the Landscape Character Assessment.
Tranquillity means different things to different people. There is a consensus for tranquillity to relate to audible (e.g. birdsong, natural sounds, moving water) and visual (e.g. stars and perceived wildness) peace. Tranquillity can support health and well-being and be a key contributor to quality of life. However, tranquillity can be impacted by changes in noise, visual intrusion and light pollution.
Tranquillity in South Oxfordshire and Vale of White Horse District Councils has been mapped by combining sets of indicators that fall into ‘positive’ or ‘negative’ categories. Positive indicators enhance the feeling of tranquillity and represent the relative abundance, perception or experience of nature. When combined, positive indicators represent places that are visually tranquil and with natural sounds more prominent than non-natural noise. Negative indicators detract from tranquillity. When combined they represent areas which are less tranquil and where visual and noise disturbances are present.
Aims and objectives
The aims of this study are to:
- Create maps of tranquillity for South Oxfordshire and Vale of White Horse District Councils.
- Produce key findings/statistics for the two local authorities to aid in the interpretation of the results.
- Produce a report which summarises the method and findings of the study.
- Make recommendations on how tranquillity can be protected, enhanced and created in the districts.
- Host the final tranquillity map online to show this information in a visually engaging and easy to understand way.
The study was supported by one stakeholder workshop that took place during the development phase, ensuring that a diverse range of perspectives inform the development of the tranquillity indicators in the study area.
What does this report cover
The final tranquillity assessment provides maps at two different scales: the assessment covering all South Oxfordshire and Vale of White Horse District Councils at 50m resolution, and an assessment for the larger settlements only, at 10m resolution. The full coverage assessment results are available to explore in the interactive web map in the Tranquillity Results section. The larger settlements tranquillity outputs are available as static maps throughout Chapter 2, Chapter 3 and Chapter 5.
This report provides details of the method used to create the final map layers for the tranquillity assessment covering South Oxfordshire and Vale of White Horse District Councils at 50m resolution as well as the larger settlements at 10m resolution. This final mapping phase takes into account the stakeholder feedback received following the pilot mapping.
This report also includes a user guide giving recommendations on how the tranquillity assessment can be used to protect, enhance and create tranquillity through development.