Chapter 5 – Heading figures and statistics
Using GIS (ESRI’s Spatial Analyst extension), quantitative analysis has been undertaken to explore the dark skies data in more details. This section presents the findings of this analysis. The following areas were analysed:
- All South Oxfordshire and Vale of White Horse
- South Oxfordshire and Vale of White Horse separately to highlight trends that may be specific to each district.
- National Landscapes.
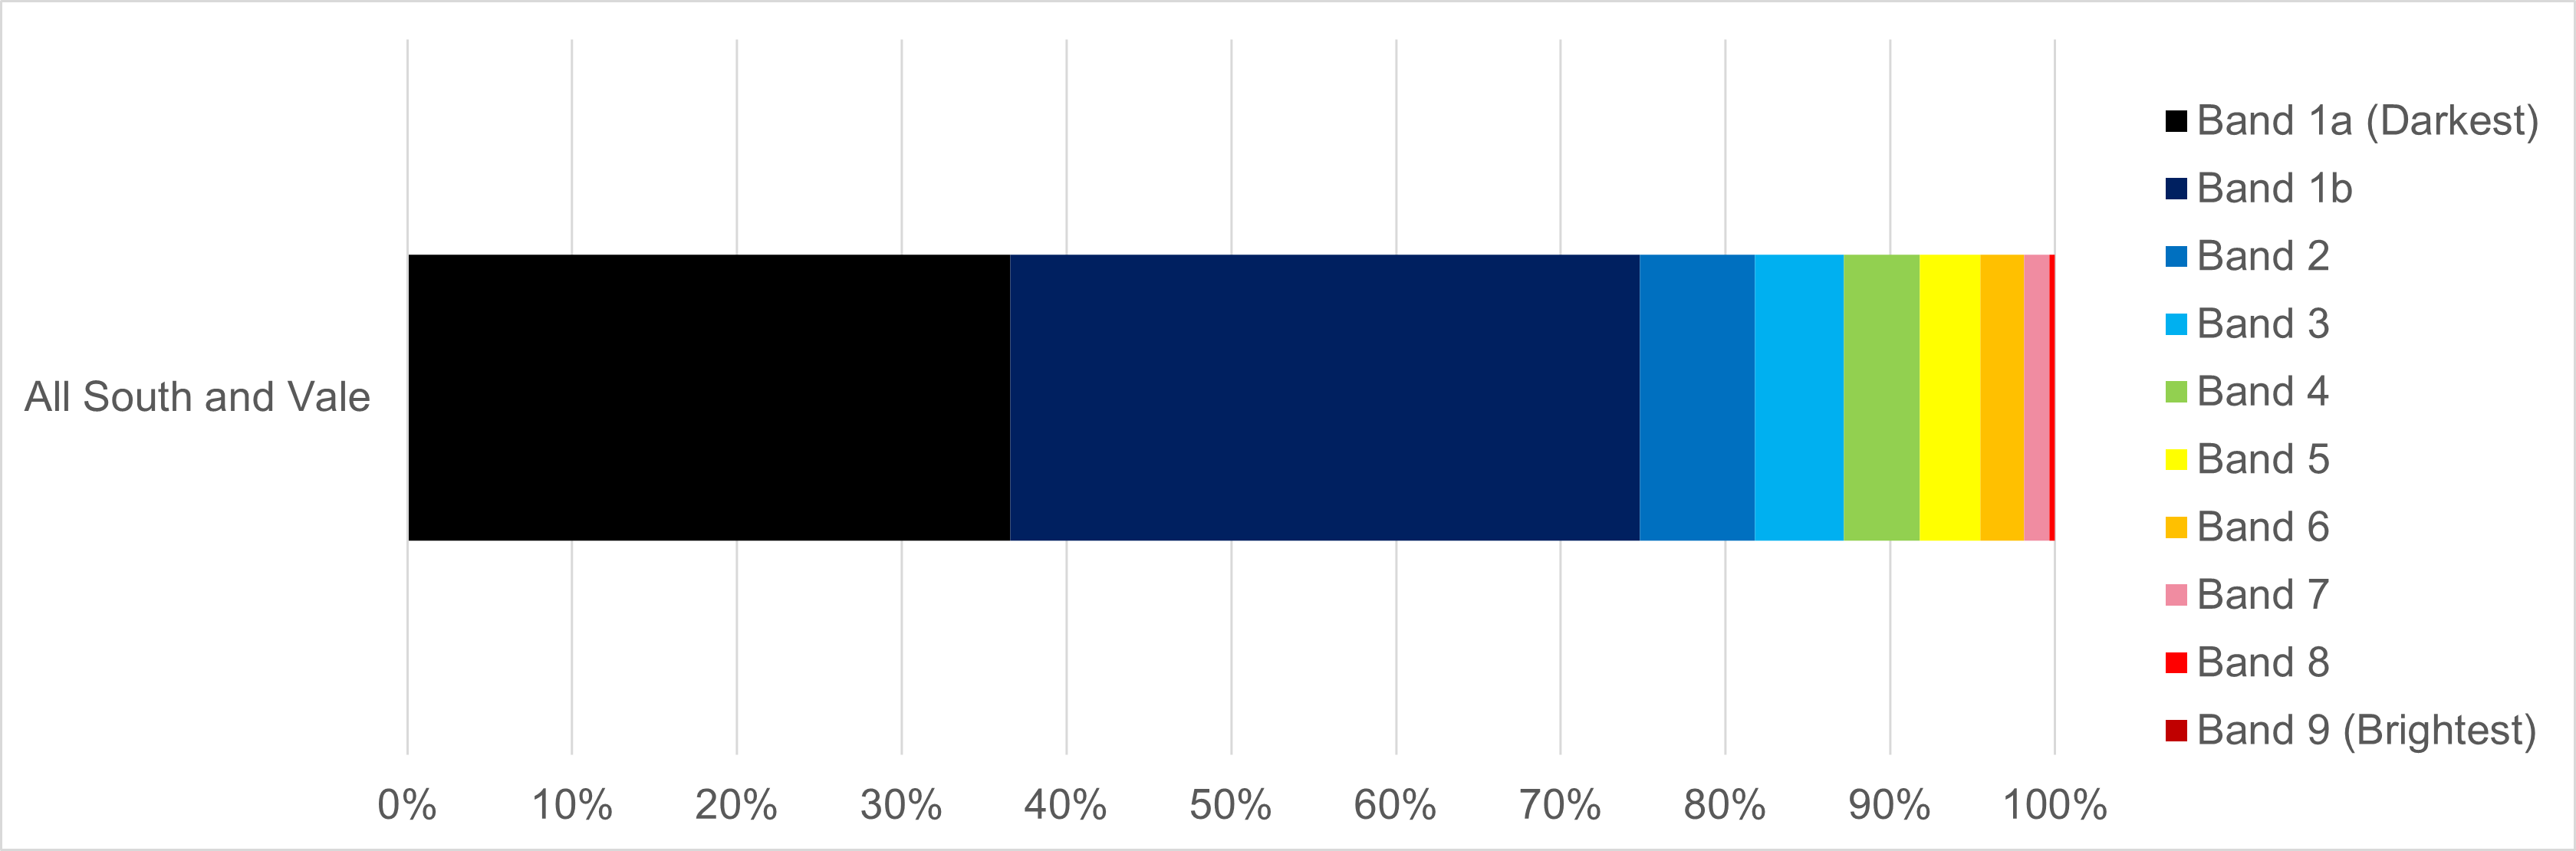
The following graph shows the breakdown of land coverage across All South Oxfordshire and Vale of White Horse into the ten colour bands of brightness values. The majority of the study area is within the darkest category (74.6% in colour band 1, which includes two sub-categories as shown in Table 4 a), and there are no band 9 (brightest) pixels within the area. Only 0.3% of the area falls within band 8 (16-32 nw/cm2/sr).
The same category/colour bands as the 2016 national map have been used for this assessment (with the addition of a subdivision within Band 1). As per the note in Chapter 4, the data values are not directly comparable to the national 2016 map. This means that significantly more area is shown as being in the darkest category than in 2016. Whilst there may be some exceptions, this should not be interpreted as an overall reduction in light pollution over this time period.
Figure 5.1: Percentage of South and Vale falling into each brightness category
×![]()
Figure 5.1: Percentage of South and Vale falling into each brightness category
Table 5a: Area and percentage of South Oxfordshire and Vale of White Horse in each brightness category

×![]()
Table 5a: Area and percentage of South Oxfordshire and Vale of White Horse in each brightness category
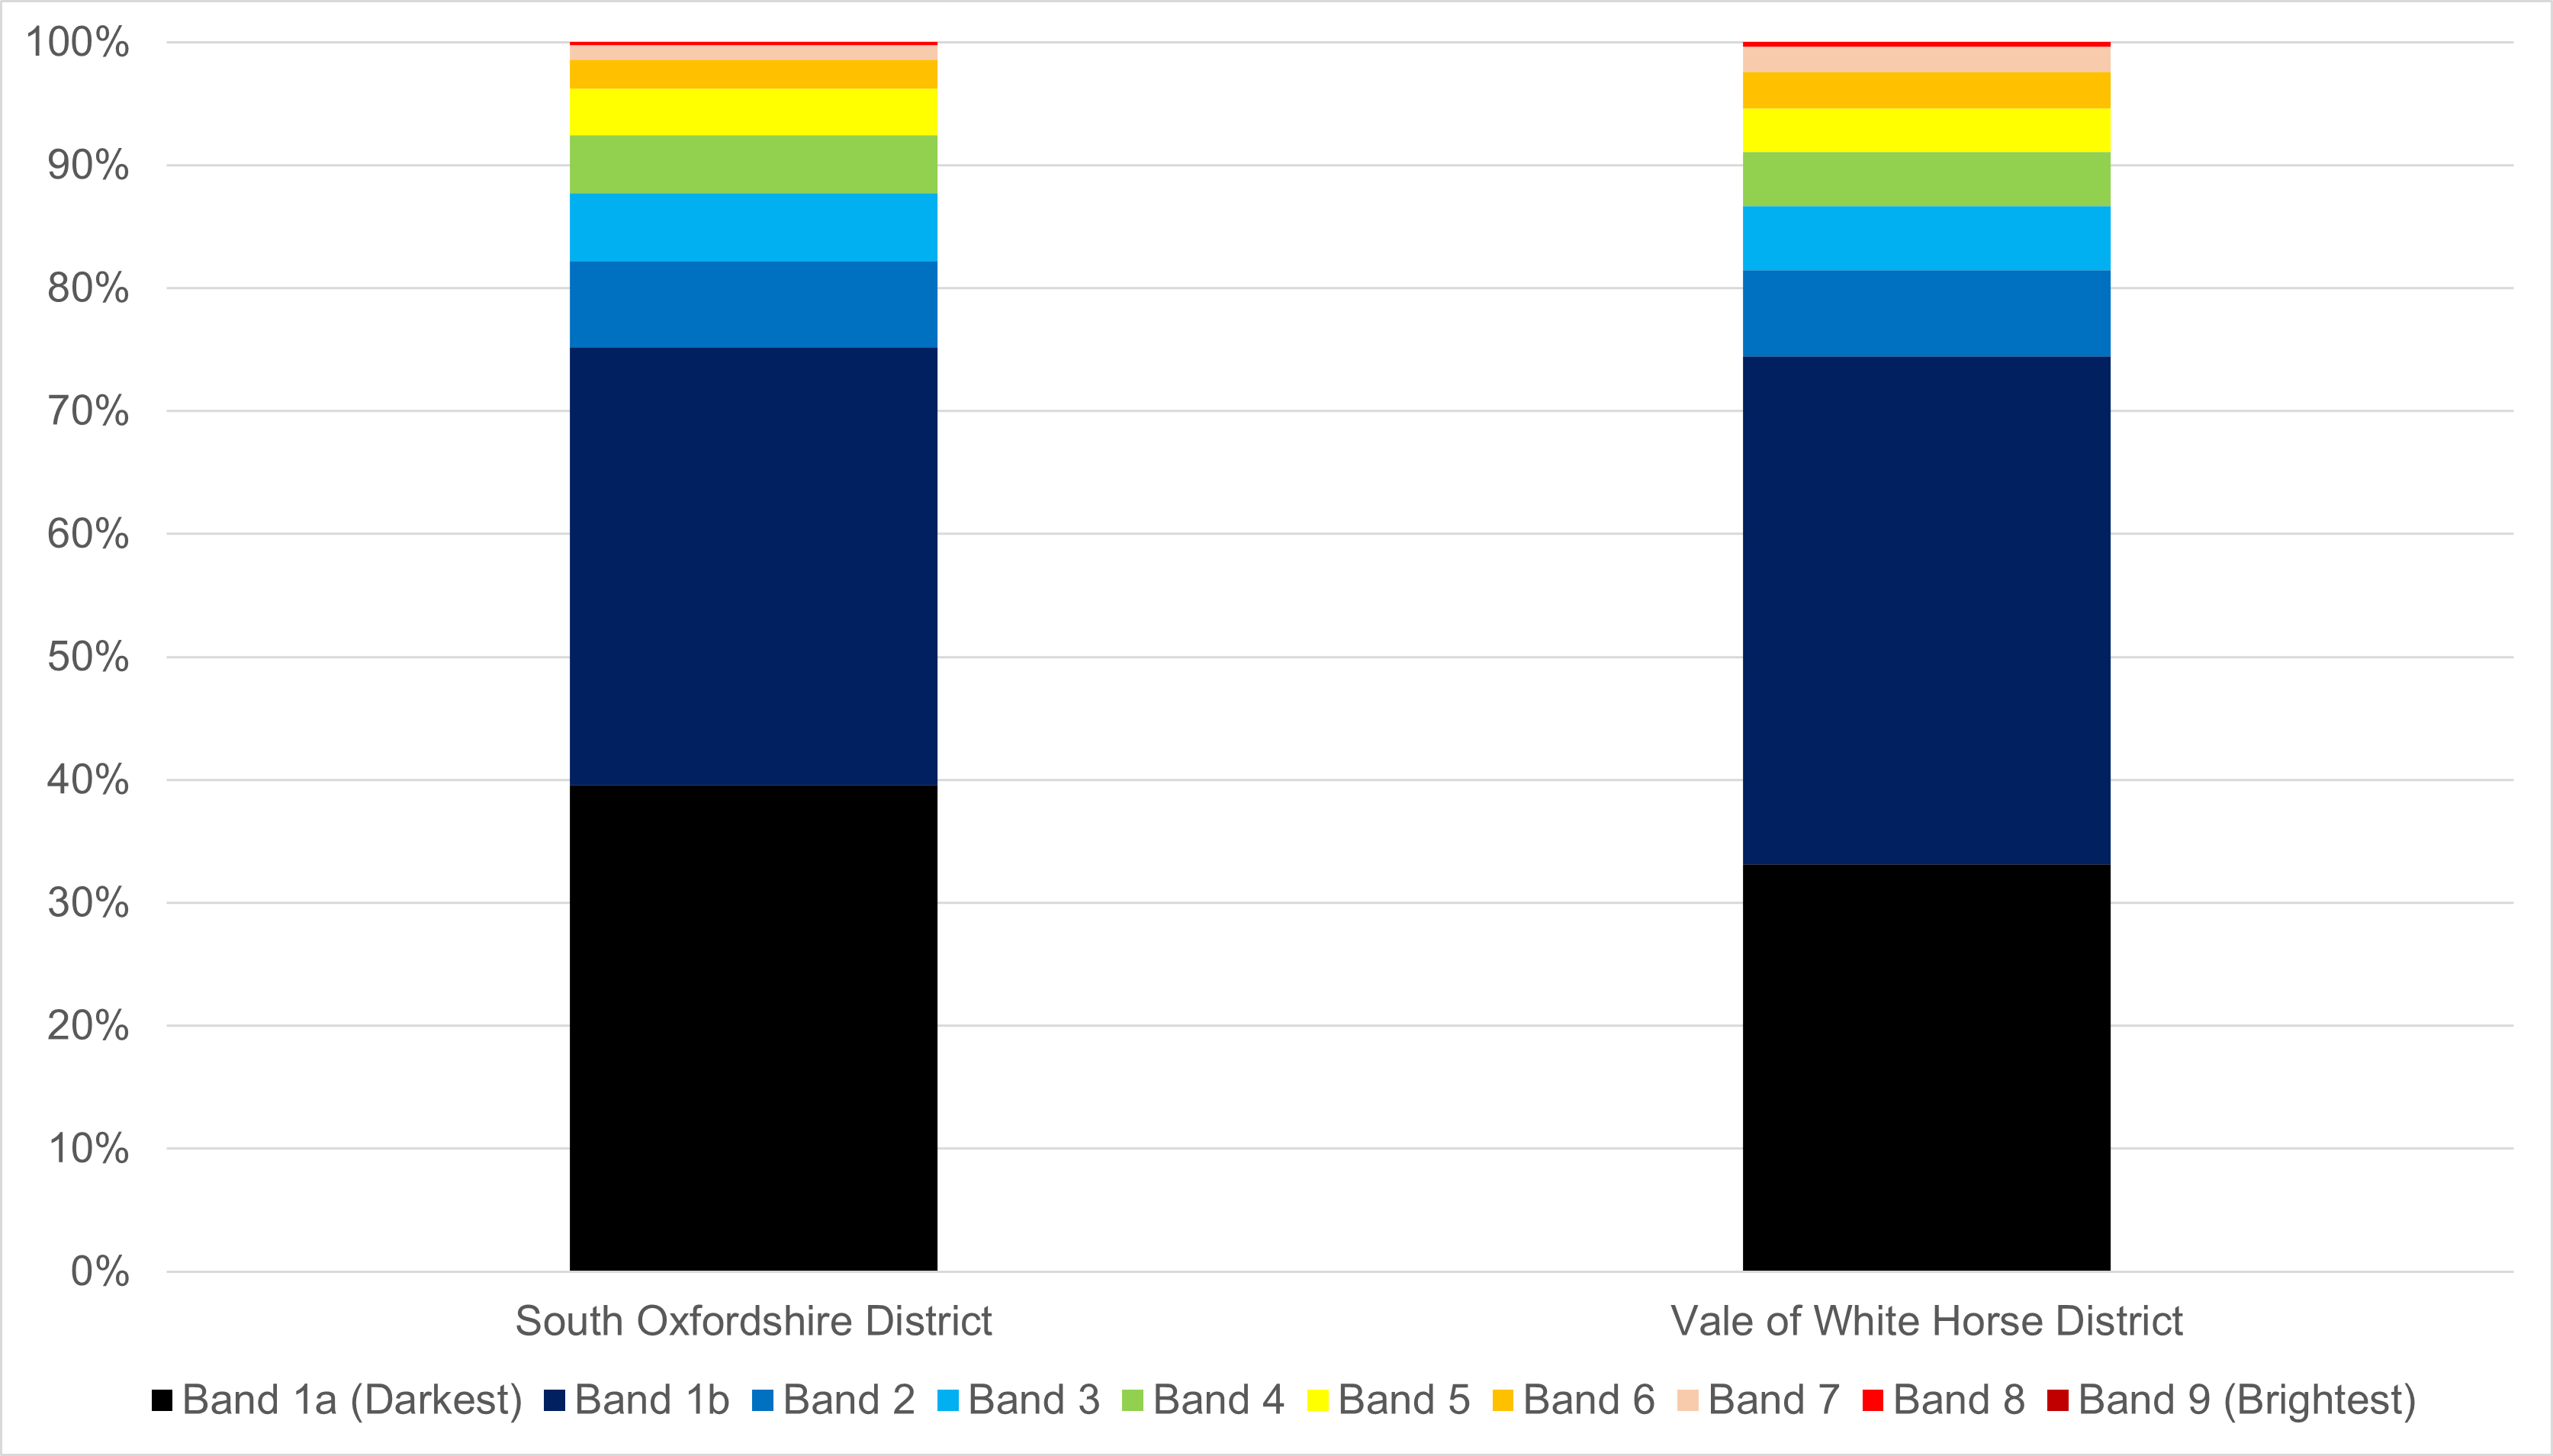
The following figure and table show the percentage of land and land area (kilometres squared (km2)) falling into each of the colour bands for South Oxfordshire and Vale of White Horse Local Authority boundaries. Both local authorities have a similar profile across the different brightness categories, with South Oxfordshire having a slightly higher percentage of land falling within colour bands 1 (including 1a and 1b), 2 and 3 which are associated with darker pixels. South Oxfordshire also has a higher percentage of land falling within the top 50% of the darkest colour band (category 1a) compared to band 1b. Vale of White Horse has a higher proportion of land falling in band 1b than 1a.
×![]()
Figure 5.2: Percentage of land falling into each brightness category per local authority

×![]()
Table 5b: Percentage of each local authority falling into each brightness category
Table 5c shows the maximum and average (mean) brightness values for each local authority. South Oxfordshire has a slightly darker average brightness value than Vale of White Horse, with both authorities’ average values corresponding to the colour bands 2 and 3, which represent very dark pixels. The brightest value in both South Oxfordshire and Vale of White Horse is found in Didcot / Milton (Vale of White Horse only). In South Oxfordshire there is another area of high brightness values located where the local authority boundary stops south of Oxford, as well as in Wallingford, Henley-on-Thames, Thame and the border with Reading. High brightness values in Vale of White Horse are observed in Abingdon-on-Thames, Harwell Campus, Faringdon, Watchfield, Wantage and Grove. The data is shown alongside the local authority and National Landscapes boundaries in the Dark Skies Results Map.
Table 5c: Comparison of maximum and average brightness values by local authority (NanoWatts/cm2/sr)
| Local Authority | Maximum brightness value | Average brightness value (mean) |
| Vale of White Horse | 22.70 | 0.53 |
| South Oxfordshire | 29.34 | 0.42 |
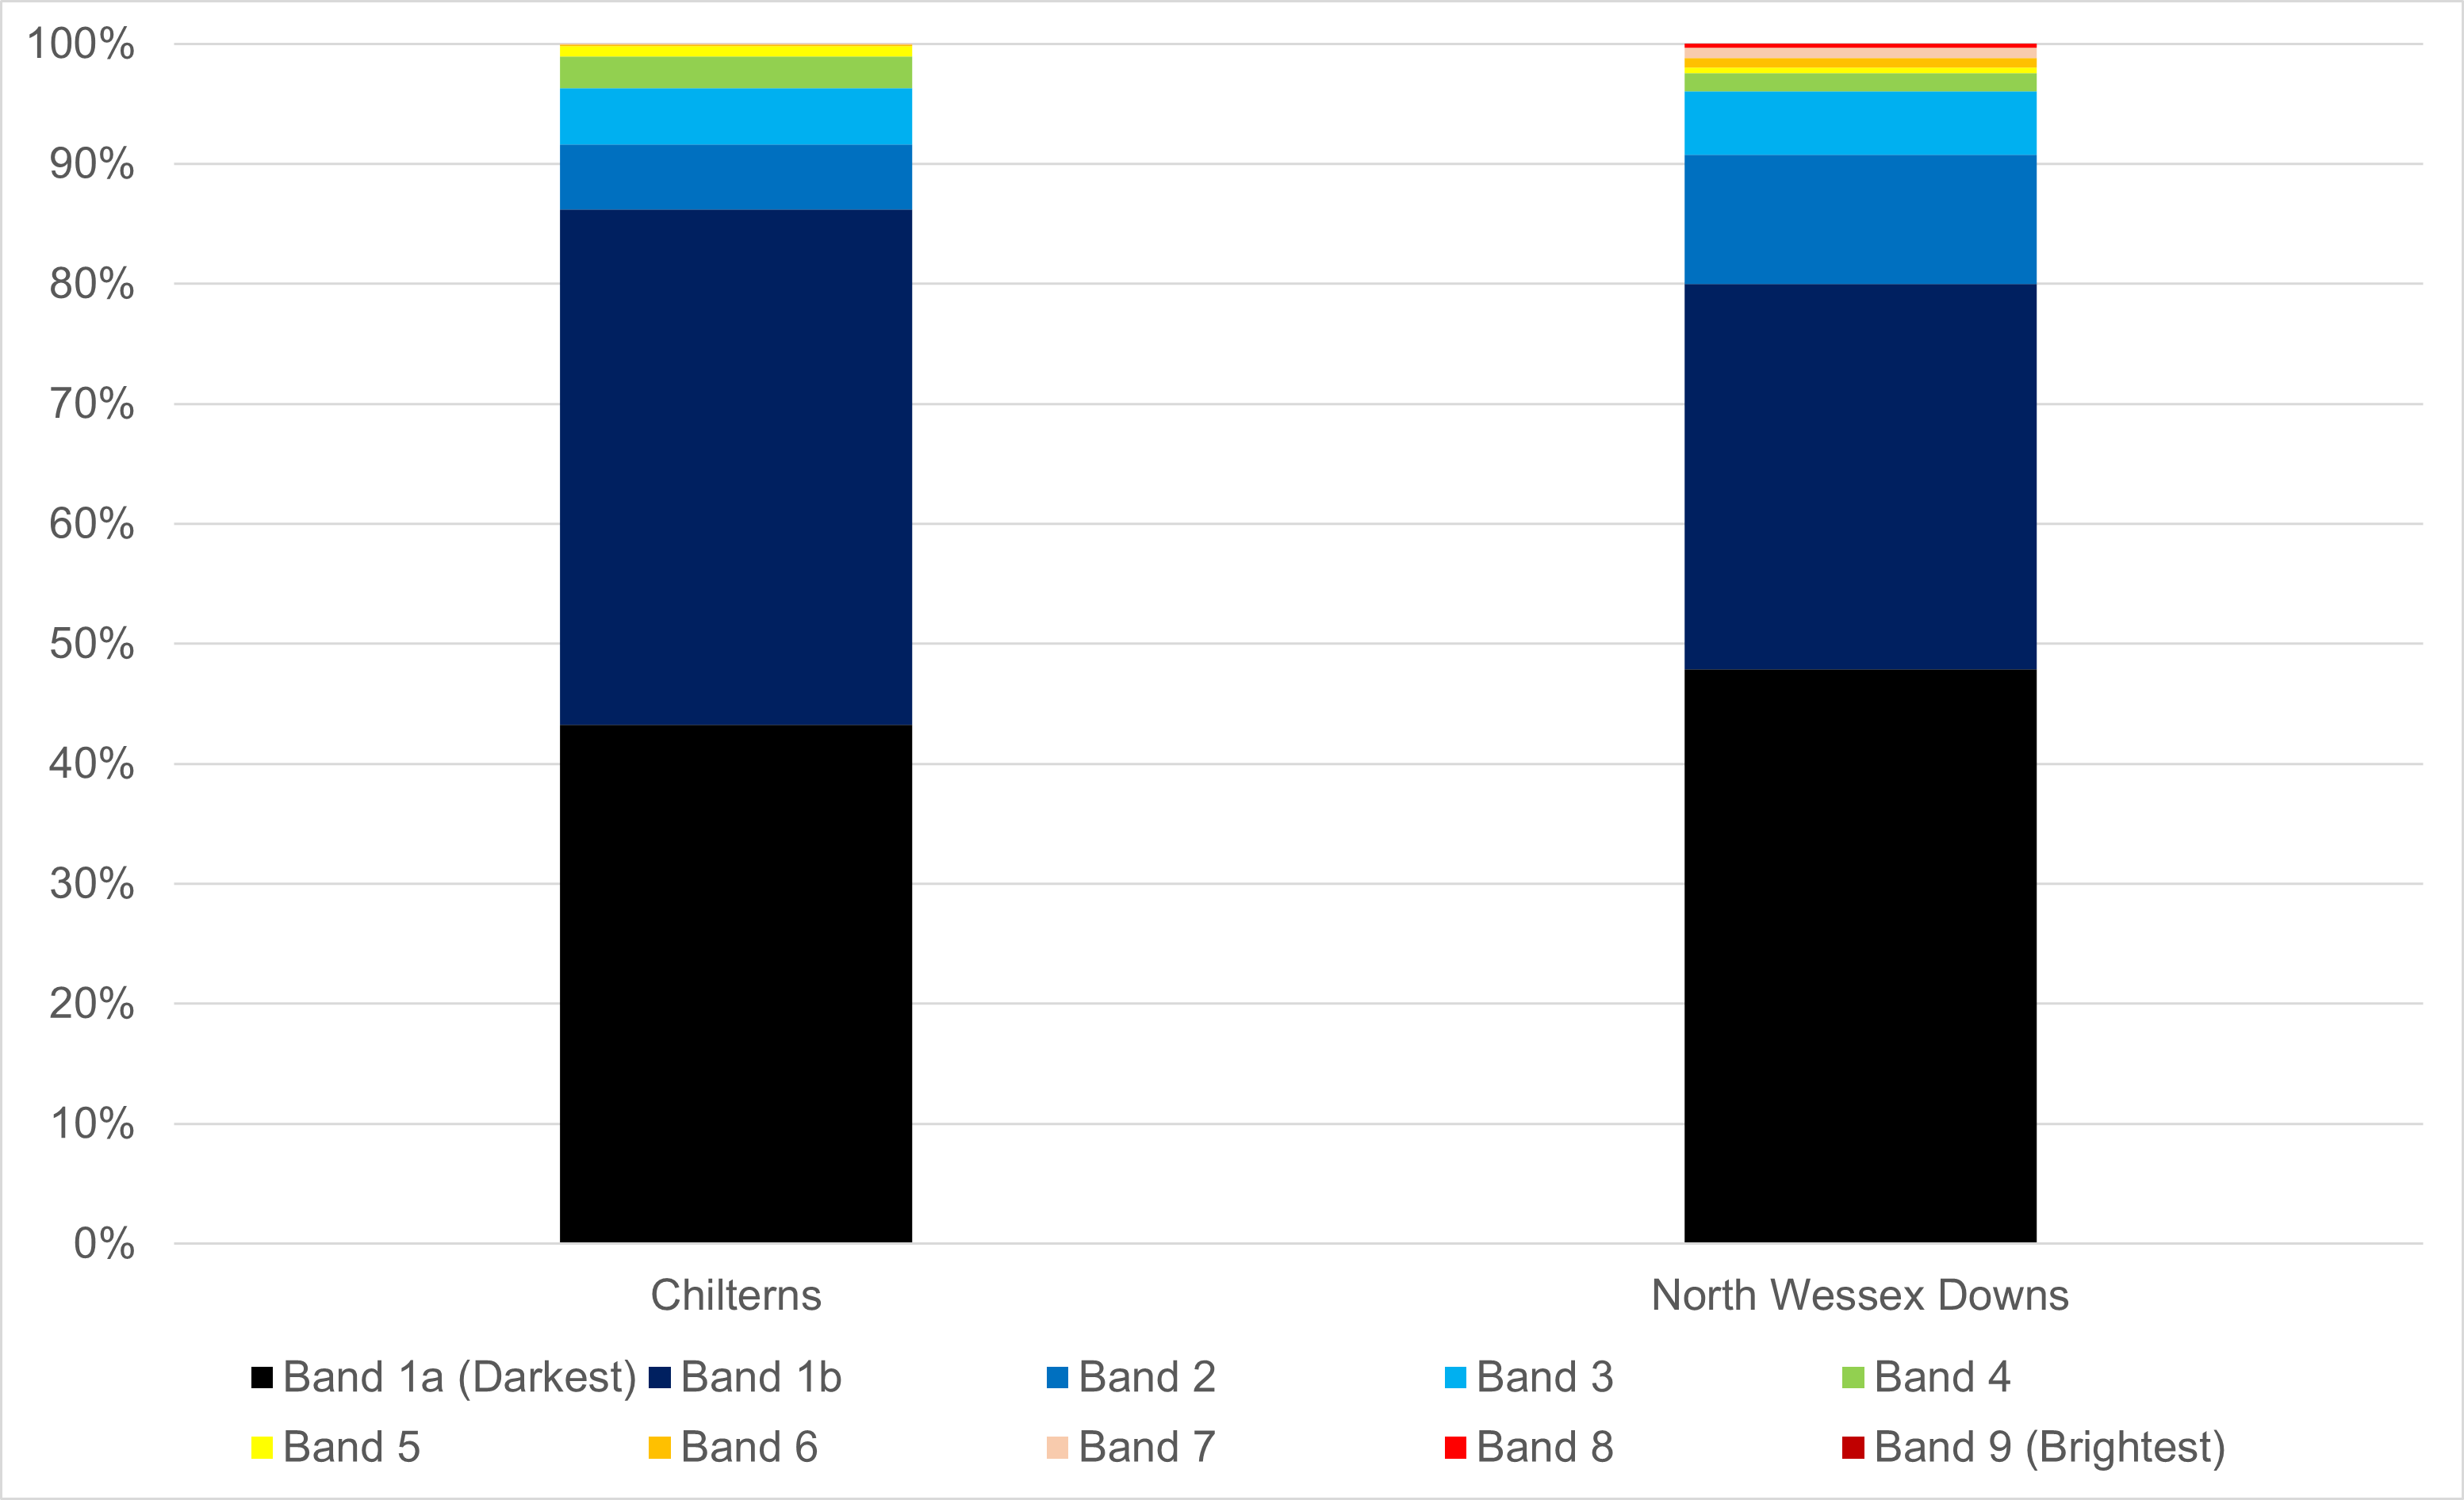
Figure 5.3 shows that the two National Landscapes in the South Oxfordshire and Vale of White Horse study area experience little light pollution, with 91.7% of Chilterns and 90.1% of North Wessex Downs falling within the darkest categories (colour bands 1a, 1b and 2). North Wessex Downs has a higher percentage of land falling within the darkest colour band (category 1a). The Chilterns National Landscape has 1% of its land area within the brightest bands 5-7, with its brightest pixel being in band 7. North Wessex Downs National Landscape has a higher percentage of its area (2.4%) within the brightest four bands 5 to 8.
Figure 5.3: Percentage of each National Landscape falling into each brightness category
×![]()
Figure 5.3: Percentage of each National Landscape falling into each brightness category
Appendix E contains a full breakdown of the proportion of each National Landscape in each brightness category, both as a percentage of the total National Landscape area and in square kilometres.