Chapter 6 – Identifying Environmental Zones
What does the guidance say?
Current CNEA legislation recognises light pollution as a statutory nuisance, but it does not explain how to control light pollution. This can be found in the following National and International bodies for lighting guidance: The Commission Internationale de l’Eclairage (International Commission on Illumination), (CIE), the Society of Light & Lighting (SLL), and the Institute of Lighting Professionals (ILP).
As the above guidance documents all apply a common Environmental Zoning system and provide associated light level limitations, they enable a quantifiable assessment of light pollution and the ability to apply, where necessary, exterior lighting control measures.
The Environmental Zoning system is summarised in Table 6a.
Table 6a: The Environmental Zoning system (reproduced from ILP GN01/21)
| Zone | Surrounding | Lighting environment | Examples |
| E0 | Protected | Dark (Sky Quality Metre 20.5+) | Astronomical Observable dark skies, UNESCO starlight reserves, IDA dark sky places. |
| E1 | Natural | Dark (Sky Quality Metre 20 to 20.5) | Relatively uninhabited rural areas, National Parks, National Landscapes, IDA buffer zones etc. |
| E2 | Rural | Low district brightness (Sky Quality Metre ~15 to 20) | Sparsely inhabited rural areas, village or relatively dark outer suburban locations. |
| E3 | Suburban | Medium district brightness | Well inhabited rural and urban settlements, small town centres of suburban locations. |
| E4 | Urban | High district brightness | Town/City centres with high levels of night-time activity. |
Identifying Environmental Zones for South Oxfordshire and Vale of White Horse
The updated map of dark skies and light pollution (Dark Skies Results map) uses satellite data (based on a 400 m2 pixels), to identify radiance levels from existing night-time lighting which is then translated into a map showing nanowatts per square centimetre steradian as described in Chapter 4.
The satellite data was classified into ten separate bands (the nine colour bands used in the national map with further sub-division within band 1) representing darkest to brightest pixels, as detailed in Chapter 4. Hoare Lea have used their professional judgment to assign each brightness band from the dark skies map into Environmental Zones E1 to E4 as shown in Table 6b.
The resulting zones in the two districts are presented in the Dark Skies Results map.
Environmental Zones (EZ) are defined in CIE 150 and ILP GN01/21 guidance, and these documents provide a descriptive definition of each zone. It is important to state that CIE 150 puts no numerical values on a particular EZ. GN01/21 references Sky Quality Meter (SQM) values for Zones E0 to E2, however SQM readings are difficult to capture. Therefore the geographical location descriptive ‘Examples’ in column 4 Table 6a (Dark Skies places (E0) through to Town/City Centres (E4)) provide a better understanding of an existing Environmental Zone based on human activity in an area.
Important note: It must be noted that no E0 zones have been identified using the approach detailed in this assessment. However, the approach used to map EZ in the North Wessex Downs Guide to Good External Lighting [See reference [i]] differs and has identified E0 areas around the darkest areas of the 2016 CPRE Night Blight map [See reference [ii]]. These E0 areas are located within the E1 zones of this report. E0 zones tend to be associated with areas that have achieved Dark Skies accreditation from the IDA, but the ILP’s definition of the EZ states that a more stringent zone classification may be applied to protect specific areas. Therefore, there is flexibility to increase the EZ in a protected designation like a National Landscape, which is what was done in the North Wessex Downs Guide to Good External Lighting.
[i] North Wessex Downs Area of Outstanding Natural Beauty (2021) ‘Dark Skies of the North Wessex Downs: A Guide to Good External Lighting’ – https://www.northwessexdowns.org.uk/wp-content/uploads/2021/11/Lighting_Guide_07-05_MEDRES.pdf
[ii] CPRE (2016) ‘Night Blight 2016: Mapping England’s Light Pollution and Dark Skies’ – https://www.cpre.org.uk/resources/night-blight-2016-mapping-england-s-light-pollution-and-dark-skies/
Table 6b: Assigning Environmental Zones in South Oxfordshire and Vale of White Horse using the 2022 dark skies map

×![]()
Table 6b: Assigning Environmental Zones in South Oxfordshire and Vale of White Horse using the 2022 dark skies map
The following graph shows the proportion of South Oxfordshire and Vale of White Horse that fall into each Environmental Zone. Most of the districts’ area is within Environmental Zone E1 (87.7% in South Oxfordshire and 86.3% in Vale of White Horse). 8.4% of South Oxfordshire falls in E2 and 4% in E3. There is a similar trend in Vale of White Horse, with 7.9% in E2 and 5.4% in E3. There is no E4 in either of the district.
Figure 6.2: Percentage of South Oxfordshire and Vale of White Horse falling into each Environmental Zone

×![]()
Figure 6.2: Percentage of South Oxfordshire and Vale of White Horse falling into each Environmental Zone
Environmental Zones cannot be defined solely based on the dark skies map produced using satellite data. The reason being each pixel of the satellite data captures an area of 400 square metres. This method gives a general overview of the amount of upward light across an area, from which we can infer an Environmental Lighting Zone. However, the map does not provide enough detail to differentiate specific lighting activity within the pixel.
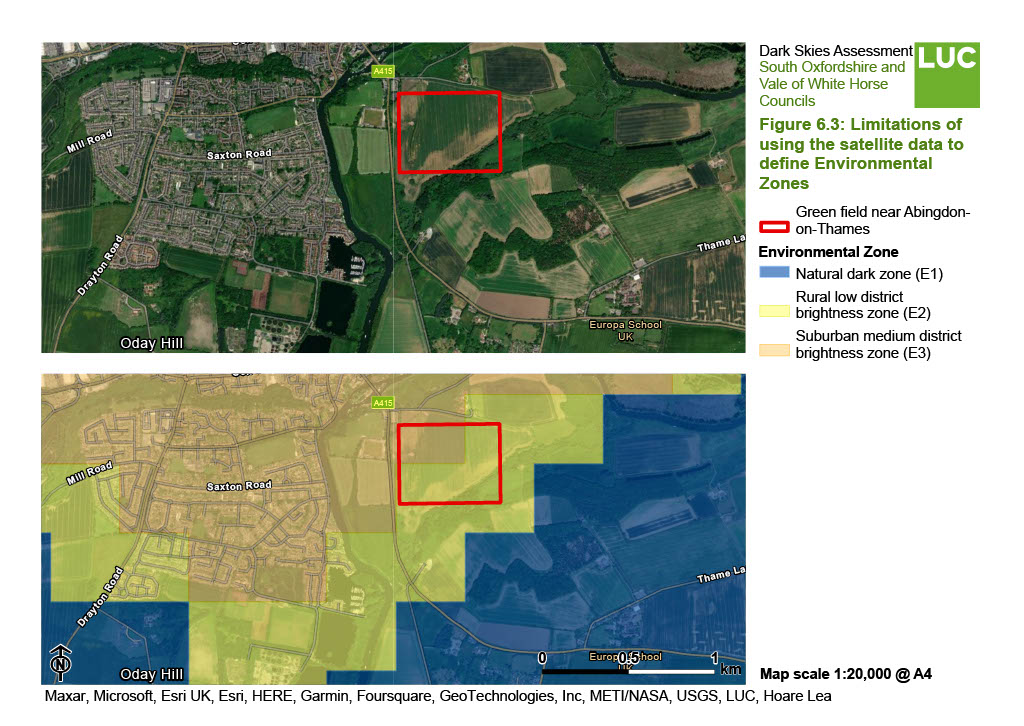
The limitations of the pixel resolution are more evident when viewing peripheries between developed and undeveloped areas on the map. Chapter 4 sets out satellite data limitations. Figure 6.3 provides an example of the limitations of the satellite data when categorising Environmental Zones. It shows surrounding rural areas in the south-east of Abingdon-on-Thames, such as green fields, being categorised in E2 and E3 even though there is no artificial light present in certain parts of this area (it is clear that unlit fields are present).
Figure 6.3: Example of limitations of using the satellite data to define Environmental Zones
×![]()
Figure 6.3: Example of limitations of using the satellite data to define Environmental Zones
As explained previously, the dark skies map has its limitations with regards to the specifics of the current areas. Understanding the current artificial lighting in a certain area is a way of clarifying Environmental Zone. Therefore it may be necessary to carry out one or both of the following exercises in order to get a more detailed understanding of the Environment Zone a particular site falls within:
- Desktop site survey using online maps
- Physical baseline on-site survey
Desktop site survey uses professional judgment to ascertain the Environmental Zone using online data. The downside to using online data is that it is not always an accurate reflection of the present condition because online maps can be out of date.
A physical baseline on-site survey consists of the lighting professional determining the appropriate number and location of sample readings to be taken, taking into account the light sensitive receptors in and around the proposed development area. Four vertical readings at 1.5 metre above ground oriented towards the proposed site, and at 90, 180 and 270° from this, as well as horizontal (ground) measurements should be recorded at each sample location. An appropriately high quality light metre (V-Landor and Cosine Corrected) should be used such as a Minolta T10a.
In order to identify sensitive locations, it may be advisable that the lighting professional should liaise with an ecologist.
ILP PLG04 provides a more detailed understanding of desktop and on-site survey approaches.